

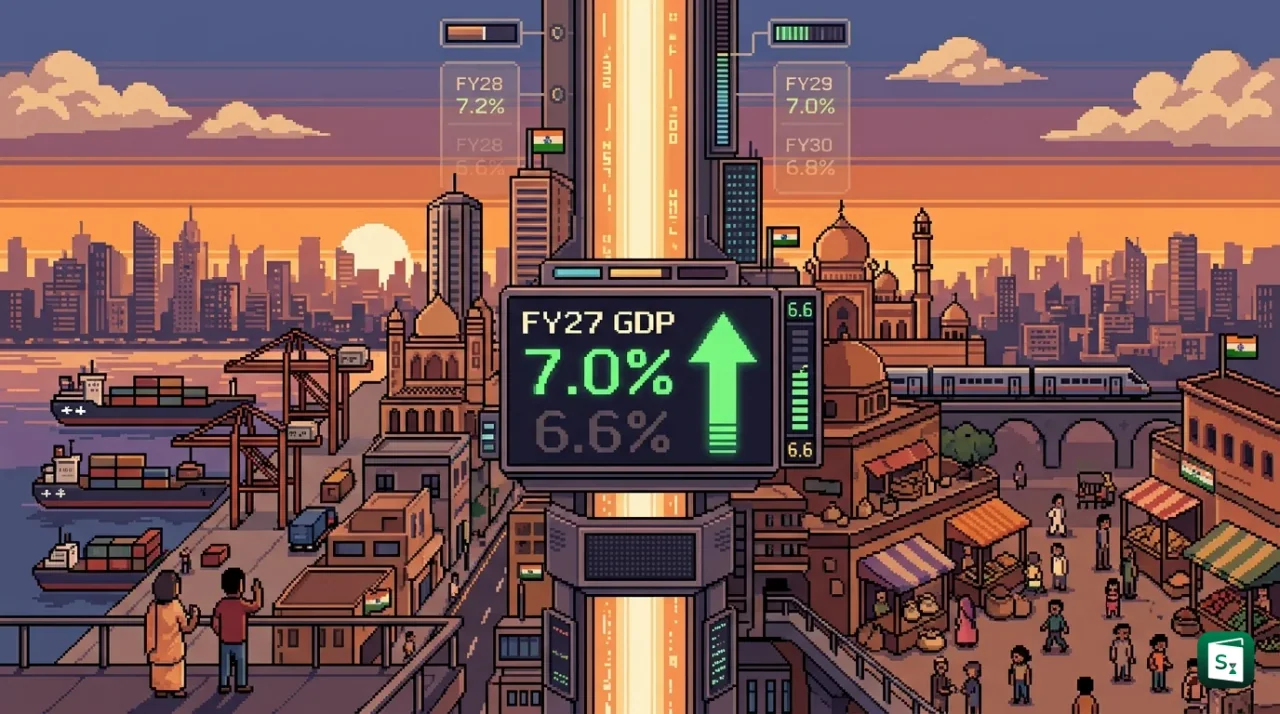
S&P Global Ratings has raised its forecast for India GDP growth in FY27 to 7% from 6.6% in its report titled Economic Outlook Asia-Pacific Q4 2026: Exports, Domestic Demand Will Shore Up Growth. The upgrade followed stronger than expected growth of 7.8% in the April to June quarter of 2026. The agency also projected growth of 7.2% in FY28, 7% in FY29 and 6.8% in FY30, keeping India among the fastest growing major economies in the world.
S&P Global Ratings Raises India GDP Forecast for FY27 to 7 Percent
S&P Global Ratings published its revised outlook in September 2026 as part of its quarterly review of Asia Pacific economies. S&P Global Ratings is an American credit rating agency headquartered in New York. It is one of the three large global rating agencies, along with Moody’s Ratings and Fitch Ratings, and it assesses the ability of companies and governments to repay their loans. The agency also publishes regular economic forecasts for major regions.
The S&P Global Ratings report raised the forecast for FY27, which is the financial year ending on 31 March 2027, by 40 basis points to 7%. A basis point is one hundredth of a percentage point, so 40 basis points means 0.40 percentage points. The earlier forecast was 6.6%. S&P Global Ratings kept its forecasts for the next two years unchanged at 7.2% for FY28 and 7% for FY29, and added a projection of 6.8% for FY30.
| Financial Year | S&P Global Ratings GDP Growth Projection |
|---|---|
| FY27 (ending March 2027) | 7% (revised up from 6.6%) |
| FY28 (ending March 2028) | 7.2% |
| FY29 (ending March 2029) | 7% |
| FY30 (ending March 2030) | 6.8% |
S&P Global Ratings expects growth to ease in the second half of FY27. The report notes that the temporary boost from rationalisation of the Goods and Services Tax (GST) and cuts in personal income tax will slowly fade. GST is the single indirect tax that India applies on most goods and services. Even with this moderation, S&P Global Ratings expects domestic demand and exports to keep overall growth strong.
What Is GDP of India?
Gross Domestic Product (GDP) of India is the total value of all final goods and services produced within India in a year or quarter. It measures the size and health of the economy. Real GDP shows volume growth at constant prices, while nominal GDP shows value at current prices.
GDP is the full form of Gross Domestic Product. It counts only final goods and services, not intermediate inputs, to avoid double counting. In India, GDP is estimated for each quarter and each financial year. The financial year in India runs from 1 April to 31 March.
India publishes two main measures of output. Nominal GDP measures output at current market prices, so it rises with both higher production and higher prices. Real GDP measures output at constant prices of a fixed base year, so it shows true volume growth without the effect of inflation. The difference between the two is captured by the GDP deflator, which is a ratio that shows the overall price change.
The Ministry of Statistics and Programme Implementation prepares the estimates. The Reserve Bank of India, the central bank of India headquartered in Mumbai, uses these estimates to set interest rate policy. For the new GDP series, India uses 2022-23 as the base year. In the first quarter of FY27, from April to June 2026, real GDP stood at ₹81.36 lakh crore and grew by 7.8%, while nominal GDP stood at ₹88.27 lakh crore and grew by 10.3%.
How Is GDP Calculated in India?
In India, GDP is calculated by adding consumption, investment, government spending and net exports, and by measuring value added across agriculture, industry and services. The National Statistical Office collects production, sales, employment and price data, then adjusts for taxes, subsidies and inflation using the 2022-23 base year.
The expenditure method uses a simple formula. GDP equals private consumption plus investment plus government spending plus net exports. Net exports means exports minus imports. Private consumption is called Private Final Consumption Expenditure. Investment is called Gross Fixed Capital Formation, which includes spending on machines, buildings and infrastructure.
The production method adds up Gross Value Added (GVA) from all sectors and then adds net taxes. GVA is the value of output minus the value of inputs used. Net taxes means indirect taxes minus subsidies. In the first quarter of FY27, real GVA grew by 8.2%, slightly faster than GDP growth, because net taxes grew more slowly.
The National Statistical Office, which works under the Ministry of Statistics and Programme Implementation, collects data from farms, factories, shops, service firms and government budgets. It also uses the Index of Industrial Production, company accounts, crop estimates and employment surveys. The base year for GDP comparison is important because it fixes the price level. India shifted to the new base year of 2022-23 to reflect present consumption and production patterns more accurately.
Why Did S&P Revise the Forecast Upwards?
S&P Global Ratings revised the FY27 forecast because the April to June quarter performed better than it had expected. The Indian economy grew by 7.8% in that quarter, compared with 6.9% in the same quarter last year. Growth had been 8.6% in the January to March quarter, so the pace slowed from the previous quarter but remained strong. The result was also higher than the Reserve Bank of India projection of 7% for the quarter.
S&P Global Ratings pointed to four drivers. The first was robust industrial activity. Manufacturing grew by 9.2% in the quarter. Electricity, gas and related utilities grew by about 8.9% after a weak period last year. Construction grew by 7.7%. Financial, real estate and professional services grew by about 12%, which made services the strongest support for growth.
The second driver was healthy private consumption. Private Final Consumption Expenditure grew by 7.1% in the quarter. Lower income tax and rationalisation of GST rates left more money with households. Sales of passenger vehicles rose sharply and consumer confidence surveys showed optimism about income and jobs.
The third driver was strong goods and services exports. Total exports grew by 12% in the quarter. Cumulative merchandise and services exports during April to July 2026 rose by 13.16% from the previous year. Demand for electronics, pharmaceuticals, engineering goods and technology services held up despite higher energy costs and supply chain stress linked to tensions in West Asia.
The fourth driver was accelerating government investment. Real investment grew by 11.9% in the quarter. Central government capital expenditure rose by 18.6% in the quarter and by 29.9% in some monthly counts, with a full year target of 11.5% growth. Public spending on roads, railways, power and production linked incentive schemes supported factory output and jobs. Bank credit to industry grew by 20% and to services by 22.9% in July, which showed that funds were reaching firms.
India GDP Rank and Size in Trillion Dollars
India is one of the largest economies in the world in nominal GDP terms, but its position in dollar rankings moves with exchange rates and data revisions. The International Monetary Fund (IMF), headquartered in Washington D.C. and established in 1944, publishes the World Economic Outlook twice a year to compare GDP by country.
In dollar terms, India had a nominal GDP of about $4.19 trillion in the April 2025 estimates and briefly stood as the fourth largest economy ahead of Japan. In the April 2026 estimates, India was placed sixth for FY27 with nominal GDP of about $3.92 trillion (as of September 2026). The change did not reflect weak domestic growth. It reflected depreciation of the rupee from about ₹84.57 per dollar in 2024 to about ₹88.48 in 2026, and a downward revision of nominal GDP in rupee terms after the shift to the new 2022-23 base year. The United Kingdom stood at about $4 trillion and Japan at about $4.44 trillion in the same estimates. The IMF expects India to move back to fourth place in FY28 and to become the third largest economy by FY2030-31, behind the United States and China.
| Rank | Country | Approx. Nominal GDP in April 2026 Estimates |
|---|---|---|
| 1 | United States | $30.51 trillion |
| 2 | China | $19.23 trillion |
| 3 | Germany | $4.74 trillion |
| 4 | Japan | $4.44 trillion |
| 5 | United Kingdom | $4 trillion |
| 6 | India | $3.92 trillion |
India remains the fastest growing major economy even when its dollar rank slips, because domestic output in rupees continues to grow at about 11% in nominal terms and about 7 to 8% in real terms. This gap between fast real growth and a lower dollar rank shows how currency movements affect country wise GDP comparisons.
What Is GDP Per Capita and Where Does India Stand?
GDP per capita is GDP divided by population. It shows average output per person and is often used as a rough guide to average income.
India has a population of about 147.66 crore, the largest in the world. Because the population base is very large, India ranks low on per capita income even though total GDP is large. India GDP per capita is about $2,813 in nominal terms and about $12,130 on a purchasing power parity basis, which adjusts for lower prices in India. The global rank on nominal per capita income is around 135 to 140. The United States is above $89,000, Germany is near $55,911 and China is near $13,687 in the same comparison. This contrast explains why total size and average income tell two different stories about the Indian economy.
How Do Other Agencies Forecast India GDP for FY27?
S&P Global Ratings is not alone in raising the outlook. The strong first quarter led to a wave of upgrades in September 2026 by global agencies and multilateral lenders. All the new forecasts place India above the Reserve Bank of India projection and confirm India as the fastest growing country among major economies.
| Agency | FY27 Forecast | Previous Forecast | Note |
|---|---|---|---|
| S&P Global Ratings | 7% | 6.6% | 40 basis points upgrade in September 2026 |
| Asian Development Bank (ADB) | 7% | 6.6% | Upgrade in Asian Development Outlook September 2026 |
| Fitch Ratings | 6.9% | 6.4% | 50 basis points upgrade |
| Moody’s Ratings | 7% | 6% | Sharpest upgrade among the three global agencies |
| Organisation for Economic Cooperation and Development (OECD) | 7.1% | 6.3% | Highest forecast in the September round |
| Reserve Bank of India (RBI) | 6.7% | 6.9% in April estimates | Central bank projection for FY27 |
| International Monetary Fund (IMF) | 6.4% | July 2026 update | Still calls India a key engine of global growth |
The Asian Development Bank (ADB), headquartered in Manila and established in 1966, also raised India to 7% and projected 7.1% for FY28. The Organisation for Economic Cooperation and Development (OECD), headquartered in Paris, raised India to 7.1%. Fitch Ratings projected 6.5% growth in both FY28 and FY29.
The upgrades share the same logic. Resilient consumption, healthy investment, strong services exports and government capital spending offset the drag from higher energy costs linked to the West Asia conflict and a weaker monsoon. The RBI Survey of Professional Forecasters in March 2026 had placed FY27 growth at 6.9%, with private consumption at 7% and investment at 7.1%, which shows that Indian forecasters were already close to the new global view.
What Lies Ahead for Growth and Prices
S&P Global Ratings expects consumer inflation in India to average 5.1% in FY27. Inflation means a general rise in prices. The RBI targets inflation of 4% within a band of 2 to 6%. Because inflation is expected to stay above the target, S&P Global Ratings expects the RBI to raise its policy repo rate by 25 basis points during FY27. The repo rate is the rate at which the RBI lends money to banks. When this rate goes up, loans become costlier and spending slows, which helps bring prices down. The repo rate stands at 5.25% (as of September 2026) after cuts in 2025.
Food prices are a key risk. Cumulative rainfall was 15% below normal as of 9 September, which may affect farm output and push up prices of cereals, vegetables and milk. Higher crude oil prices also raise transport and import costs, since India imports nearly 90% of its crude oil. Disruption around the Strait of Hormuz, a narrow sea route for oil shipments, has added to freight and energy costs.
S&P Global Ratings expects Asia Pacific growth of 4.6% in 2026 and 4.4% in 2027, supported by technology exports linked to artificial intelligence. For India, strong technology and services exports plus resilient domestic demand should offset weak global conditions. Growth is likely to ease in the second half of FY27 as tax cut effects fade, but public capital spending, production linked incentives and new trade agreements with the United Kingdom, the European Union and the United States should support manufacturing and services. Over the medium term, S&P Global Ratings sees growth staying near 7%, which keeps India on track toward its goal of a $5 trillion economy and developed nation status by 2047.
Key Takeaways
- S&P Global Ratings raised India’s FY27 GDP growth forecast to 7% from 6.6% in its Economic Outlook Asia-Pacific Q4 2026 report.
- S&P Global Ratings projected India’s growth at 7.2% in FY28, 7% in FY29 and 6.8% in FY30.
- India’s real GDP grew by 7.8% in the April to June quarter of FY27, with real GVA growth at 8.2%.
- S&P Global Ratings expects consumer inflation at 5.1% in FY27 and a 25 basis points hike in the RBI repo rate.
- India uses 2022-23 as the base year for GDP calculation, and GDP data is released by the Ministry of Statistics and Programme Implementation.