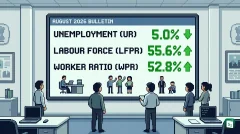


India’s unemployment rate for persons aged 15 years and above eased to 5.1% in July 2026 from 5.5% in June 2026, according to the Periodic Labour Force Survey (PLFS) Monthly Bulletin released by the National Statistics Office (NSO) under the Ministry of Statistics and Programme Implementation (MoSPI). The drop, the lowest in four months, was driven by a sharp improvement in rural areas where joblessness fell to 4.5% while urban unemployment held steady at 6.7%. At the same time, the Labour Force Participation Rate (LFPR) and Worker Population Ratio (WPR) rose across the country, signalling stronger engagement in the labour market.
What Did the July 2026 PLFS Bulletin Show?
The July 2026 Monthly Bulletin is the 16th in the monthly PLFS series since the methodology was revamped in January 2025. It was released on 17 August 2026 and covers persons aged 15 years and above using the Current Weekly Status (CWS) approach, which refers to activity in the seven days before the survey date. The estimates are based on a large national sample of 3,71,021 persons, including 2,11,411 in rural areas and 1,59,610 in urban areas.
Three headline indicators were reported at the all India level, and all three moved in a positive direction compared with June 2026. The Unemployment Rate (UR) declined, while LFPR and WPR increased after a period of softening from March to May and a flat June. On a year on year basis, the picture was stable at the headline level but urban areas saw a clear improvement.
| Indicator (15 years and above, CWS) | July 2026 | June 2026 | July 2025 |
|---|---|---|---|
| Unemployment Rate (UR) - All India | 5.1% | 5.5% | 5.2% (broadly stable) |
| UR - Rural | 4.5% | 5.0% | 4.4% (up 0.1 pp) |
| UR - Urban | 6.7% | 6.6% | 7.2% (down 0.5 pp) |
| Labour Force Participation Rate (LFPR) - All India | 55.4% | 54.4% | 54.9% |
| Worker Population Ratio (WPR) - All India | 52.5% | 51.4% | 52.0% |
In absolute terms, the decline in unemployment was accompanied by more people entering the labour force and finding work. This is important because a fall in unemployment that happens alongside a rise in participation is seen as a sign of genuine job creation, rather than people simply stopping their search for work.
Understanding Key Labour Market Indicators
To read any PLFS bulletin correctly, three related ratios should be understood together. Each answers a different question about the labour market.
Labour Force Participation Rate, Worker Population Ratio and Unemployment Rate
Labour Force Participation Rate (LFPR) is the percentage of persons in the labour force among the total population. The labour force includes both those who are working and those who are seeking or available for work. In simple terms, LFPR tells us how many people want to be economically active.
Worker Population Ratio (WPR) is the percentage of employed persons in the population. It tells us how many people actually have work. It is also called the employment rate. Even if someone works for at least one hour on any day during the reference week, they are counted as employed under CWS.
Unemployment Rate (UR) is the percentage of unemployed persons among the persons in the labour force. A person is counted as unemployed in a week if they did not work even for one hour on any day during the reference week but sought or were available for work for at least one hour on any day. Therefore, UR = (Unemployed / Labour Force) x 100.
The three are linked. If LFPR rises and WPR rises faster, UR falls. If LFPR rises but WPR does not keep pace, UR can rise even when more people are working.
Current Weekly Status Approach
The monthly bulletins use the Current Weekly Status (CWS) method. Under CWS, the activity status of a person is judged on the basis of what they did during the last seven days before the survey date. This captures short term movements in jobs and is more sensitive to seasonal shifts, such as agricultural cycles, than the annual Usual Status (ps+ss) approach which uses a 365 day reference period. The Usual Status measures a person’s main activity over the year, while CWS gives a weekly snapshot. That is why monthly and quarterly bulletins are published on CWS, while the comprehensive annual reports provide both CWS and Usual Status.
Rural Push, Urban Pause: Breaking Down the Numbers
The improvement in July was not uniform. Rural India drove the recovery, while urban areas showed a mixed picture.
The overall LFPR rose to 55.4% in July from 54.4% in June, after declining between March and May and remaining flat in June. Rural LFPR climbed by 1.4 percentage points to 58.0% from 56.6%, while urban LFPR edged up only slightly to 50.4% from 50.1%. Compared with July 2025, when overall LFPR was 54.9%, the July 2026 figure was higher by 0.5 percentage points, with rural LFPR up 1.1 percentage points from 56.9% and urban LFPR down 0.3 percentage points from 50.7%.
The overall WPR rose to 52.5% from 51.4%, its first increase since February 2026. Rural WPR increased by 1.6 percentage points to 55.4% from 53.8%, while urban WPR moved marginally to 47.0% from 46.8%. Year on year, overall WPR was higher by 0.5 percentage points from 52.0% in July 2025, with rural WPR up 1.0 percentage point from 54.4% and urban WPR unchanged at 47.0%.
On unemployment, the rural rate fell sharply to 4.5% from 5.0%, while the urban rate was broadly unchanged at 6.7% against 6.6%. Year on year, the overall and rural UR remained broadly stable, while urban UR declined by 0.5 percentage points from 7.2% in July 2025.
Gender Trends and Youth Pressure Points
Disaggregation by gender shows a strong rise in female participation but uneven gains in employment.
Female LFPR for persons aged 15 years and above jumped to 34.4% in July from 32.7% in June. Rural female LFPR rose to 38.8% from 36.6%, and urban female LFPR increased to 25.3% from 24.8%. Year on year, overall female LFPR was higher by 1.1 percentage points from 33.3% in July 2025, with rural female LFPR up 1.9 percentage points from 36.9%.
Female WPR also improved. Rural female WPR rose sharply by 2.5 percentage points to 37.2% from 34.7%, and urban female WPR moved to 23.1% from 22.7%.
For unemployment, male UR improved both sequentially and annually. Overall male UR fell to 5.0% in July from 5.3% in June, and was 0.3 percentage points lower than 5.3% in July 2025. Rural male UR fell to 4.6% from 4.9% and matched the July 2025 level, while urban male UR was stable month on month but fell by 0.7 percentage points to 5.9% from 6.6% a year earlier.
Female UR eased month on month overall and in rural areas, but remained above last year’s level. The notable concern was urban female UR, which rose to 8.8% in July from 8.4% in June, broadly stable compared with 8.7% in July 2025. This means nearly nine of every 100 urban women in the labour force were seeking work but not finding it during the reference week.
Youth data added another layer of caution. For the age group 15 to 29 years, the unemployment rate was estimated at 15.6% in July, higher by 0.7 percentage points than a year earlier, with no corresponding change in youth LFPR. This points to more young people entering the job market but not proportionately finding work. The quarterly bulletin for April to June 2026 had also flagged youth unemployment at 15.9%, up from 15.0% in the previous quarter, driven especially by young women.
About the Periodic Labour Force Survey
From Annual to Monthly: The 2025 Revamp
The Periodic Labour Force Survey (PLFS) is India’s primary source for data on employment and unemployment for planning, policy and research. It was launched on 1 April 2017 by the National Sample Survey Office (NSSO), now part of the National Statistics Office (NSO) under MoSPI. The PLFS was created to fill a gap, earlier large scale employment surveys were conducted only once in about five years, which made it hard to track short term changes in the job market.
Initially, PLFS had two objectives, to measure quarterly changes in key labour indicators for urban areas only in CWS, and to produce annual estimates in both Usual Status (ps+ss) and CWS for both rural and urban areas. The first annual report for July 2017 to June 2018 was released in May 2019.
From January 2025, the methodology was revamped to meet the demand for more frequent and granular data. Now the survey provides monthly estimates at the all India level and quarterly estimates for states and union territories and for all India with rural and urban breakups, both under CWS. It also continues to provide annual estimates in both Usual Status and CWS. The July 2026 bulletin is part of this new monthly series, and earlier monthly bulletins from April 2025 to June 2026 have already been released. Before the revamp, quarterly bulletins up to December 2024 covered only urban areas, but from the April to June 2025 quarter they cover both rural and urban areas.
The Survey Machinery: Sample and Method
The PLFS uses Computer Assisted Personal Interviewing (CAPI) with tablets for direct data entry, which improves accuracy and speed. For monthly bulletins, field teams survey tens of thousands of households across rural and urban India each month. The July 2026 estimates rest on this large sample, which allows disaggregation by gender, sector (rural or urban) and age group.
The Ministry of Statistics and Programme Implementation (MoSPI) itself was formed on 15 October 1999 through the merger of the Department of Statistics and the Department of Programme Implementation. It is the nodal agency for the organized development of the statistical system and is headquartered at Khurshid Lal Bhawan, Janpath, New Delhi. The National Statistics Office (NSO) comprises the Central Statistical Office (CSO) and the National Sample Survey Office (NSSO), and it conducts the PLFS.
Why These Numbers Matter for the Economy
Labour market indicators are among the most watched economic signals because they link directly to incomes, demand and productivity.
When LFPR and WPR rise together while UR falls, as happened in July, it suggests that more people are confident enough to look for work and are actually finding it. The rural led nature of the July recovery is important. A fall in rural unemployment from 5.0% to 4.5% alongside a jump in rural LFPR to 58.0% and rural WPR to 55.4% points to stronger absorption of workers in agriculture and related activities during the monsoon linked season. This can support rural consumption, which is a key driver of overall demand.
The gender picture is nuanced. The sharp rise in rural female LFPR to 38.8% and rural female WPR to 37.2% indicates greater participation of women in the rural workforce, which has implications for household incomes and poverty reduction. However, the rise in urban female unemployment to 8.8% despite higher urban female participation suggests that urban labour markets are not creating enough suitable opportunities for women, a persistent challenge for inclusive growth.
The urban stability also matters. Urban UR at 6.7% remains higher than rural UR, reflecting more competitive and formal job markets in cities where people are more likely to report themselves as seeking work rather than taking up informal or farm based work. Year on year improvement in urban UR by 0.5 percentage points does show underlying progress, but the quarterly national UR of 5.4% in April to June 2026, up from 5.0% in the previous quarter and higher than 5.4% in the same quarter last year, indicates that the broader trend had been under pressure before the July rebound.
For policymakers, high frequency PLFS data helps in timely interventions on skilling, employment generation and social protection. It also informs assessments of the impact of external headwinds such as energy price volatility and currency movements, which were noted as factors weighing on hiring earlier in 2026.
The Way Forward
The July uptick reverses a soft patch seen from March to June 2026, but sustaining it will depend on several factors. Seasonal support from agriculture often boosts rural employment in the monsoon months, so the coming quarters will test whether gains hold when seasonal demand eases.
Attention is likely to stay on three areas. First, urban job creation, especially for women, where unemployment remains elevated. Second, youth employment in the 15 to 29 age group, where joblessness at 15.6% remains far above the headline rate. Third, the quality of employment, including the share of regular wage or salaried workers and earnings levels. The annual PLFS 2025 report noted that the share of regular wage employment rose to 23.6% in 2025 from 22.4% in 2024, with manufacturing share improving to 12.1% and agriculture share moderating to 43.0%, signals that are watched alongside monthly UR movements.
With monthly and quarterly CWS estimates now available for both rural and urban India, trends can be monitored more closely than before. The next monthly bulletins will show whether July’s rise in participation and employment marks the start of a durable improvement or a seasonal bounce.
Key Takeaways
- India’s Unemployment Rate (UR) for persons aged 15 years and above fell to 5.1% in July 2026 from 5.5% in June 2026 according to the PLFS Monthly Bulletin released by NSO under MoSPI.
- Rural UR declined to 4.5% from 5.0% while urban UR was steady at 6.7% against 6.6% in June, and the July 2026 bulletin is the 16th monthly bulletin since the January 2025 revamp based on a sample of 3,71,021 persons.
- Overall Labour Force Participation Rate (LFPR) rose to 55.4% from 54.4% and Worker Population Ratio (WPR) rose to 52.5% from 51.4%, with rural LFPR at 58.0% and rural WPR at 55.4% driving the gains.
- Rural female LFPR jumped to 38.8% from 36.6% and rural female WPR to 37.2% from 34.7%, while urban female UR rose to 8.8% from 8.4%, highlighting a continuing gender gap in urban areas.
- The survey uses the Current Weekly Status (CWS) approach with a seven day reference period, and MoSPI was formed on 15 October 1999 with its headquarters at Khurshid Lal Bhawan, New Delhi and NSO as the survey agency.