

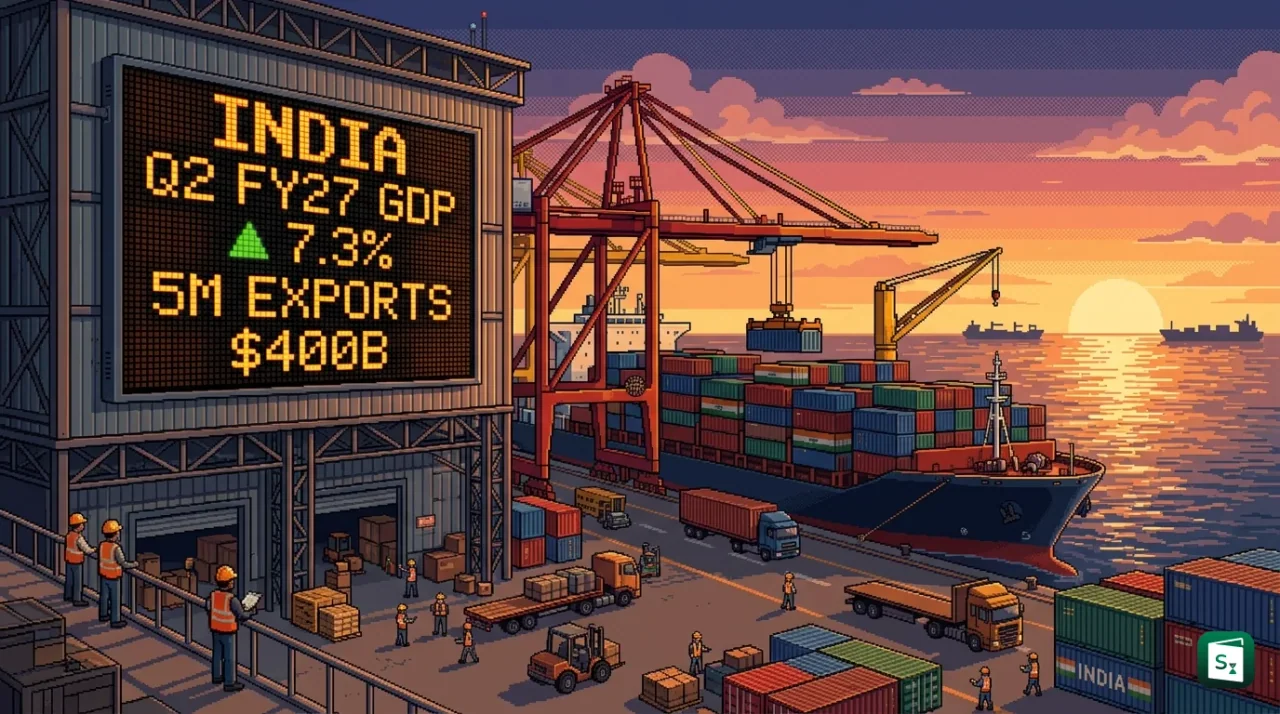
The Ministry of Finance has projected that India real GDP growth will reach 7.3% in Q2 FY27, the July to September quarter of 2026. The projection appears in the Monthly Economic Review for September 2026 released on 1 October 2026. The same review reports total exports of $399.27 billion in April to August 2026, with growth of 15.55% over last year.
What Is GDP and Why Is It Important?
The Gross Domestic Product (GDP) is the total value of all final goods and services produced within a country during a specific period. India GDP measures output inside India borders in a quarter or year. It signals the size, health and growth speed of the national economy.
GDP full form is Gross Domestic Product. The term covers only final products, so raw materials counted inside finished goods are not counted twice. GDP meaning in economics is simple. It shows how much a country produces, earns and can spend.
Why GDP is important becomes clear when policy choices are made. The Ministry of Finance uses GDP data to plan taxes, spending and borrowing. The Reserve Bank of India (RBI), the central bank headquartered in Mumbai, uses it to set interest rates. Jobs, incomes and business confidence move closely with GDP growth. A faster rise in output usually supports higher employment and stronger tax collection, while a slowdown warns of weak demand.
How GDP Is Calculated in India?
How GDP is calculated in India follows a global rule book called the System of National Accounts 2008 (SNA 2008). The National Statistics Office (NSO) under the Ministry of Statistics and Programme Implementation (MoSPI) adds up Gross Value Added (GVA) from all sectors and then adds net taxes on products. GVA is output minus the cost of inputs.
Real GDP measures output at constant prices of a base year, so it shows true volume growth without price rise. Nominal GDP measures output at current prices, so it includes both volume and price change. The gap between them is captured by the GDP deflator, a broad price index.
India shifted its GDP base year in India from 2011-12 to 2022-23 on 27 February 2026. The year 2022-23 was picked as a normal year after COVID disruptions, with fresh survey data available. The new series uses the Producer Price Index (PPI), the Index of Industrial Production (IIP) with base 2022-23, GST data, the e-Vahan vehicle registry and the Public Financial Management System (PFMS). It applies double deflation for manufacturing and agriculture, where output and inputs are adjusted with separate price indices, and uses proportional Denton benchmarking to smooth quarterly estimates.
| Concept | What It Shows | Use in India |
|---|---|---|
| Real GDP | Output at base year prices | Headline growth rate, 7.8% in Q1 FY27 |
| Nominal GDP | Output at current prices | Size of economy, tax and debt ratios |
| GVA | Output minus input cost, before taxes | Sector performance like manufacturing |
| GDP deflator | Price change hidden in nominal GDP | Separates inflation from real growth |
| Base year | Reference year for constant prices | Now 2022-23, earlier 2011-12 |
What Is the 7.3% Growth Forecast for Q2 FY27?
The Ministry of Finance expects real GDP growth of 7.3% in Q2 FY27, the quarter from July to September 2026. The nowcasting model introduced in the Economic Survey 2025-26 produced this estimate using very recent high frequency data. Official quarterly GDP data for Q2 will be released by MoSPI on 30 November 2026.
Nowcasting does not wait for full quarterly accounts. It reads live signals such as e-way bills, electricity use, fuel use, bank credit, auto sales and production of capital goods. The Ministry of Finance said growth momentum has extended into Q2 FY27, though at a more measured pace than Q1. Services activity strengthened in August on new business and jobs. Electricity and fuel consumption stayed healthy. Bank credit kept expanding. Production of capital and infrastructure goods held firm. Auto sales in rural and urban markets pointed to broad consumption demand.
The forecast sits inside a clear calendar. FY27 runs from 1 April 2026 to 31 March 2027. Q1 FY27 is April to June. Q2 FY27 is July to September. The review was published as the Monthly Economic Review for September 2026 by the Department of Economic Affairs under the Ministry of Finance.
Why Does the Finance Ministry Projection Differ from RBI Forecasts?
The Ministry of Finance projects 7.3% real GDP growth for Q2 FY27, while the RBI had earlier projected 6.4% for the same quarter. The RBI raised its Q2 estimate to 7.2% on 7 October 2026 and lifted its full year FY27 forecast to 7.1% from 6.7%. Different dates explain much of the gap between early estimates and later updates.
The RBI set its 6.4% Q2 call on 5 August 2026, before MoSPI reported strong Q1 growth of 7.8% on 31 August 2026. That Q1 result beat the RBI expectation of 7%. The Ministry of Finance nowcast came on 1 October 2026, after the Q1 surprise was known. It could factor in the stronger base. Outside forecasters also moved up after Q1. In September 2026, S and P Global Ratings, Fitch Ratings, the Organisation for Economic Co-operation and Development (OECD) and the Asian Development Bank (ADB) raised FY27 calls to a 6.9% to 7.1% range. The World Bank raised its FY27 forecast to 7.1% on 6 October 2026.
| Agency | FY27 Forecast | Q2 FY27 Forecast | Date of Update |
|---|---|---|---|
| Ministry of Finance | Not stated as full year, nowcast basis | 7.3% | 1 October 2026 |
| RBI | 7.1% | 7.2% | 7 October 2026 |
| RBI earlier view | 6.7% | 6.4% | 5 August 2026 |
| World Bank | 7.1% | Not stated separately | 6 October 2026 |
| S and P, Fitch, OECD, ADB | 6.9% to 7.1% range | Not stated separately | 23 September 2026 |
How Did the Indian Economy Perform in Q1 FY27?
MoSPI reported 7.8% real GDP growth in Q1 FY27, the April to June 2026 quarter. Real GDP stood at ₹81.36 lakh crore, up from ₹75.46 lakh crore a year earlier. Nominal GDP grew 10.3% to ₹88.27 lakh crore. Real Gross Value Added (GVA) rose 8.2% to ₹73.82 lakh crore.
Investment led the quarter. Gross investment rose 11.9%. Private household consumption grew 7.1%. Exports of goods and services rose 12% in expenditure terms. Manufacturing held strong. Services, trade, hotels, transport and communication stayed buoyant. Industrial production rose 6.7% in July 2026. Credit to industry grew 20% and credit to services grew 22.9% in July, which supported fresh capacity and working capital.
The Q1 result was the highest first quarter growth in the current data series. It gave Q2 a strong starting base, even as e-way bill volumes and factory output showed some cooling in July and August. The Ministry of Finance said domestic demand stayed resilient in a tough global setting.
What Is Behind the $400 Billion Export Outlook?
India exports touched $399.27 billion in April to August 2026, up 15.55% from $345.55 billion a year earlier. The total covers merchandise plus services. Merchandise exports reached $215.91 billion, up 17.85%. Services exports reached $183.36 billion. Total imports were $459.65 billion, up 18.01%, leaving a total trade gap of $60.38 billion.
August 2026 was the strongest month. Total exports in August grew 25.41% over August 2025. Merchandise exports in August rose 26.12% to $43.81 billion. Electronic goods exports jumped about 90%. Engineering goods rose 25%. Petroleum products rose 63.27%. Organic and inorganic chemicals also posted solid gains. The Federation of Indian Export Organisations (FIEO), set up in 1965 by the Ministry of Commerce in New Delhi, said wider market reach helped. It is the apex body for export promotion councils and commodity boards and speaks for more than two lakh exporters.
To Which Country Does India Export Most?
The United States (US) remains the top destination for exports from India, with $42.79 billion in April to August 2026, up 6.17% on year. In August alone, shipments to the US rose 21.83% to $8.32 billion. The US talks with India on a trade pact continued even as a 10% additional duty applied from August 2026.
Exports diversified fast. Shipments to Singapore rose 96.56%. Shipments to China rose 38.71% to $9.61 billion. Shipments to Tanzania rose 129% and to Malaysia rose 75.4% in the same five months. Exports to the European Union rose 3.84%. Exports to BRICS partners rose 13.3%.
| Indicator for April to August FY27 | Value | Yearly Change |
|---|---|---|
| Total exports, goods plus services | $399.27 billion | Up 15.55% |
| Merchandise exports | $215.91 billion | Up 17.85% |
| Non petroleum merchandise exports | $180.61 billion | Up 14.39% |
| Services exports | $183.36 billion | Up 12.95% estimated |
| Total imports, goods plus services | $459.65 billion | Up 18.01% |
Where Does India Stand on GDP Rank and Size?
India GDP rank is 6th in nominal terms in 2026, with output near $4.15 trillion. The US, China, Germany, Japan and the United Kingdom sit above India. By purchasing power parity (PPP), which adjusts for local prices, India is 3rd, behind only China and the US, with PPP output near $18.9 trillion.
India GDP in trillion terms draws attention because nominal size shapes global weight. In rupee terms, the new 2022-23 series puts FY26 nominal GDP near ₹345.47 lakh crore. The shift to the new base slightly lowered nominal levels, as it reassessed informal activity. Currency moves also matter. A weaker rupee lowers dollar value even when rupee growth stays strong.
India GDP per capita was about $2,813 in 2026, or near ₹2.68 lakh per person per year. The rank on per capita income is near 149th in nominal terms because output is shared across a population above 1.42 billion. PPP per capita is near $12,800, which better reflects daily buying power inside India. India remains the fastest growing major economy in 2026, with calendar year growth near 6.48%, well above peers below 2% to 4%.
What Are the Risks and the Way Forward?
The Ministry of Finance warned that India cannot rest on post COVID gains. Geopolitical divides and supply chain breaks can still hit trade, oil and capital flows. Three near term risks stand out.
First, trade ties with the US remain unsettled and tariff pressure can hurt orders. Second, crude oil prices have risen after fresh tension in West Asia, which can lift imported inflation, widen the import bill and press the rupee. Third, global AI investment is flowing to a few hubs with little India link so far, while rich economies push local manufacturing, which makes the fight for capital tougher.
Buffers remain solid. Foreign exchange reserves reached $765.9 billion on 18 September 2026, enough for about 11 months of goods imports and more than full cover for external debt at end March 2026. Net foreign direct investment shows signs of beating last year. The RBI noted net FDI hit a five year monthly high in July 2026. The current account gap stayed modest at 0.5% of GDP in Q1 FY27, helped by services exports and remittances.
The review points to a clear path. India must turn more competition friendly with faster clearances, stable taxes, strong logistics and wider trade pacts. New bilateral pacts already support goods exports. Diversified markets in Asia, Africa and Europe reduce reliance on any single buyer. Steady farm output, stable inflation near target and continued infrastructure spend can keep domestic demand firm through the second half of FY27.
Key Takeaways
- The Ministry of Finance projected 7.3% real GDP growth for Q2 FY27 in its Monthly Economic Review for September 2026.
- Real GDP grew 7.8% in Q1 FY27 to ₹81.36 lakh crore, while nominal GDP grew 10.3% to ₹88.27 lakh crore.
- Total India exports reached $399.27 billion in April to August 2026, with growth of 15.55% over last year.
- India base year for GDP is now 2022-23, revised from 2011-12 on 27 February 2026, with MoSPI as the nodal agency.
- The RBI raised its FY27 GDP forecast to 7.1% on 7 October 2026, with Q2 at 7.2%, while forex reserves stood at $765.9 billion.
- India ranked 6th by nominal GDP near $4.15 trillion in 2026 and 3rd by PPP near $18.9 trillion, with per capita income near $2,813.