
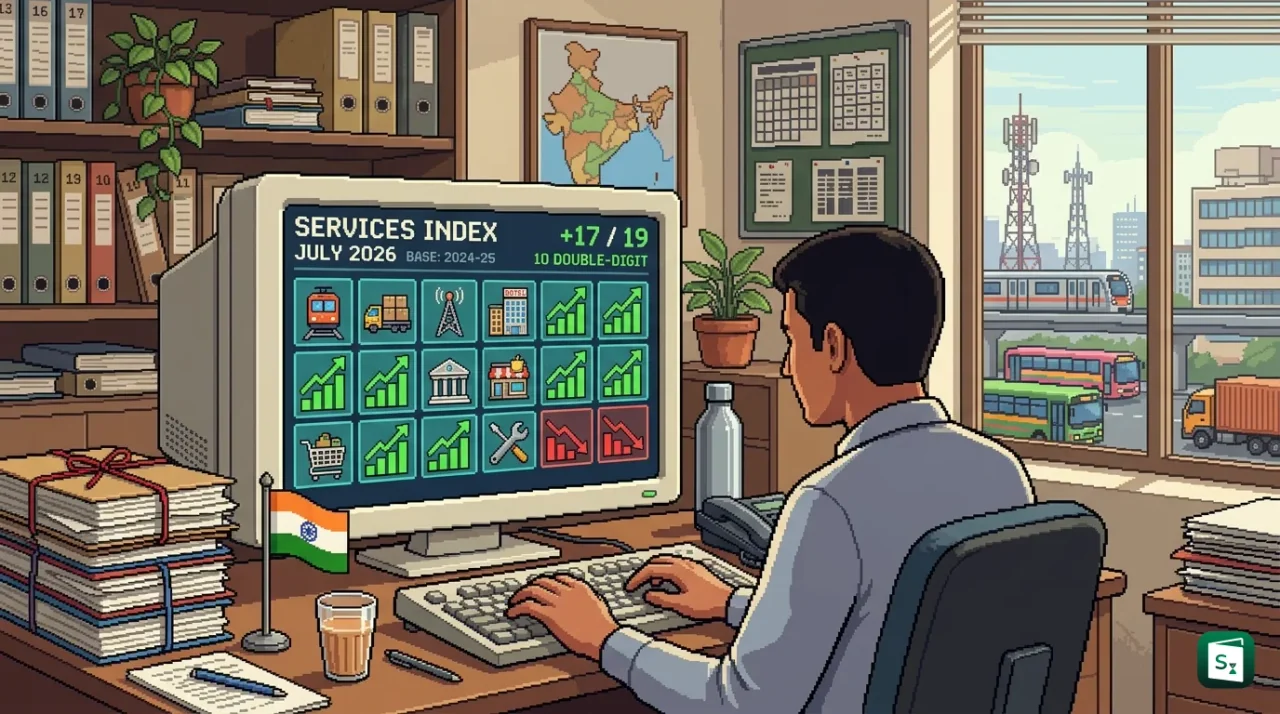
The Ministry of Statistics and Programme Implementation released the sub-sectoral trial Index of Services Production for July 2026 with 2024-25 as the base year. The index tracks 19 formal service sub-sectors and recorded positive year on year growth in 17 of them, with 10 sub-sectors posting double digit expansion over July 2025. Only Air Transport and Repair Services recorded negative growth, signalling broad strength in services output.
What Is the Index of Services Production?
The Index of Services Production (ISP) is a monthly indicator that measures short term changes in the volume of services produced in India compared to production in the base year 2024-25. The Ministry of Statistics and Programme Implementation compiles the ISP to track formal services output at high frequency and support better forecasting of national accounts.
The ISP is the services counterpart of the Index of Industrial Production (IIP). The IIP tracks factory and mining output, but India had no monthly output gauge for services despite their large role in the economy. The ISP fills that gap by giving a single comparable growth figure for services each month.
The current series is a trial series. The Ministry released the first trial figures for April 2026 on 14 July 2026, and now releases sub-sectoral trial indices around the 29th of every month with a lag of about 60 days. Trial release allows the Ministry to test methods, collect feedback and check results against quarterly and annual datasets before starting a final regular series.
July 2026 Trial Data: 17 of 19 Sub-Sectors in Positive Growth
The Ministry released the sub-sectoral trial Index of Services Production for July 2026 in late September 2026. The release covers 19 service sub-sectors and compares each sub-sector index in July 2026 with its level in July 2025. This year on year comparison removes seasonal effects and shows real volume growth.
In July 2026, 17 sub-sectors recorded positive year on year growth and 10 sub-sectors recorded double digit growth. Only two categories stayed in negative territory. Air Transport and Repair Services, which covers repair and maintenance of machinery and household goods, failed to match their July 2025 output levels.
The July result fits a pattern of broad services expansion seen since the trial began. The first release for April 2026 showed 14 sub-sectors in double digits, led by accommodation and food at 37.2 percent, retail trade at 30.8 percent and administrative and support services at 28.7 percent. The June 2026 release showed 18 sub-sectors in positive growth and 8 in double digits, led by real estate at 24.7 percent, retail trade at 18.0 percent and wholesale trade at 15.1 percent.
| Reference Month | Sub-Sectors With Positive Growth | Sub-Sectors With Double Digit Growth |
|---|---|---|
| April 2026 | Data not specified for total positive | 14 of 19 |
| June 2026 | 18 of 19 | 8 of 19 |
| July 2026 | 17 of 19 | 10 of 19 |
Base Year 2024-25 and How the Index Is Built
The trial ISP uses 2024-25 as the base year, with the base index set at 100. A base year acts as the fixed reference point. All later months are expressed as a percentage of output in that year. The Ministry chose 2024-25 because it was recent and economically normal, and because it aligns with the new Consumer Price Index (CPI) series which also uses a 2024 base.
The Ministry compiles the ISP as a Laspeyres volume index at the 2-digit level of the National Industrial Classification (NIC) 2025. In simple terms, the method fixes a basket of services and weights in the base year and then tracks how the quantity produced changes each month. Aggregation uses Gross Value Added (GVA) weights. GVA measures the value a sector adds after subtracting input costs, so sectors that add more value carry more weight in the total.
The ISP blends three main data sources. Goods and Services Tax (GST) data feed wholesale trade, retail trade and repair activities. Administrative data from ministries and regulators feed transport, banking, insurance, telecom, hotels and other tracked services. The Annual Survey of Incorporated Services Sector Enterprises (ASISSE) will support services that GST and administrative records do not capture well. Nominal values are converted to real volumes with price deflators, mainly CPI based deflators for most sub-sectors and the Wholesale Price Index (WPI) for wholesale trade.
Coverage is deliberately limited to the formal market economy in this phase. The trial covers about 60 percent of the services sector across 19 sub-sectors such as wholesale and retail trade, transport, banking, insurance, telecom, hotels and restaurants, real estate, professional and technical services, and arts and recreation. Core government work such as public administration and defence, government funded health and education, and activities such as gambling and betting stay outside the index. Private health and education indices will join later after ASISSE results become available.
A Technical Advisory Committee guided the design. The Ministry set up the committee in May 2025 under the chairpersonship of Debjani Ghosh, Distinguished Fellow at NITI Aayog, with members from academia, industry bodies and service ministries. The committee published an approach paper on 27 April 2026 for public comments and released its full report on methods, weights, deflators and release calendar in the first fortnight of July 2026.
Index of Services Production Compared With Index of Industrial Production
The ISP completes a long standing measurement gap. Industrial output has a monthly tracker for decades, while services relied on quarterly national accounts, private surveys and lagged annual data. A direct monthly comparison helps readers see why the new index matters.
What Is IIP?
The Index of Industrial Production (IIP) is a monthly composite indicator that measures short term changes in the volume of industrial output compared to a chosen base year. The National Statistics Office compiles and publishes the IIP with data from factories and source agencies.
In economics, the IIP full form clarifies its role. IIP stands for Index of Industrial Production. It tracks mining and quarrying, manufacturing, electricity, and now gas, water supply and waste management under the revised 2022-23 base. A rise in the IIP signals stronger factory activity, while a fall signals weaker production. The index is published by the National Statistics Office (NSO) in the Ministry of Statistics and Programme Implementation, usually within 28 days of the reference month under the new series.
The ISP mirrors this logic for services but uses different inputs and timing. The ISP trial uses base year 2024-25, while the IIP used base 2011-12 for many years and has now moved to base 2022-23. The ISP releases with a lag of about 60 days, longer than the IIP lag, because services data from GST and administrative systems take more time to settle.
| Feature | Index of Services Production (ISP) | Index of Industrial Production (IIP) |
|---|---|---|
| What it tracks | Volume of formal services output | Volume of industrial output |
| Coverage | 19 service sub-sectors, about 60 percent of services | Mining, manufacturing, electricity, gas, water and waste services |
| Base year in current series | 2024-25 | 2022-23 in revised series, 2011-12 in earlier series |
| Compilation method | Laspeyres volume index with GVA weights | Laspeyres index with production relatives and value weights |
| Main data sources | GST data, administrative data, ASISSE | Factory production returns through source agencies |
| Release timing | Around the 29th of every month with about 60 day lag | Monthly with a lag of about 28 days under revised norms |
| Status (as of October 2026) | Trial series from April 2026 | Long established monthly series since 1950 |
What Is MoSPI?
The Ministry of Statistics and Programme Implementation (MoSPI) is the nodal central ministry for the planned development of the statistical system in India and for coordination of statistical work across central ministries, states and international agencies. It releases national accounts, prices, industrial production and survey results through the National Statistics Office.
MoSPI came into existence as an independent ministry on 15 October 1999 after the merger of the Department of Statistics and the Department of Programme Implementation. The ministry has two wings. The Statistics Wing, built around the National Statistics Office (NSO), handles data collection, national accounts, price indices and large surveys. The Programme Implementation Wing monitors central projects costing more than ₹150 crore and the Members of Parliament Local Area Development Scheme (MPLADS). MoSPI also releases the Consumer Price Index (CPI), the IIP, periodic labour force reports and the new ISP trial releases.
Why Services Measurement Matters for the Indian Economy
Services form the largest part of the Indian economy. The services sector, also called the tertiary sector, contributed about 55 percent of Gross Value Added (GVA) in 2024-25 and accounted for 53.6 percent of GDP in the first half of 2025-26. Financial, real estate and professional services drove much of this growth, along with trade, hotels, transport and communication. India is the seventh largest exporter of services in the world, with a 4.3 percent share of global services trade in 2024, and services exports reached $387.5 billion in 2024-25.
A monthly output index improves policy and business decisions. National accounts give the full picture but arrive with a lag. Private trackers such as the HSBC India Services PMI, compiled by S and P Global from company surveys, give fast signals but measure sentiment and month on month direction, not output volumes against a base year. In July 2026, for example, the Services PMI eased to 53.3 from 57.4 in June, still above the 50 mark that separates expansion from contraction but at its weakest pace in 53 months. The ISP adds an official volume anchor to read alongside such sentiment data.
For users of data, the gains are practical. National accountants can improve quarterly GDP estimates. Economic ministries can spot stress in transport, trade or hospitality earlier. Researchers and firms can build better forecasts because the ISP will create a continuous monthly time series. Over time, a stable ISP can also sharpen inflation analysis, since more than 80 percent of non-food inflation links directly to services or to cost pressures from services.
Key Takeaways
- The trial Index of Services Production for July 2026 uses 2024-25 as the base year and covers 19 service sub-sectors.
- In July 2026, 17 of 19 sub-sectors recorded positive year on year growth and 10 recorded double digit growth.
- Air Transport and Repair Services were the only two sub-sectors with negative year on year growth in July 2026.
- The ISP is compiled by MoSPI as a monthly Laspeyres volume index with GVA weights at the 2-digit NIC 2025 level.
- MoSPI was formed on 15 October 1999 and publishes the ISP, IIP and CPI through the National Statistics Office.