

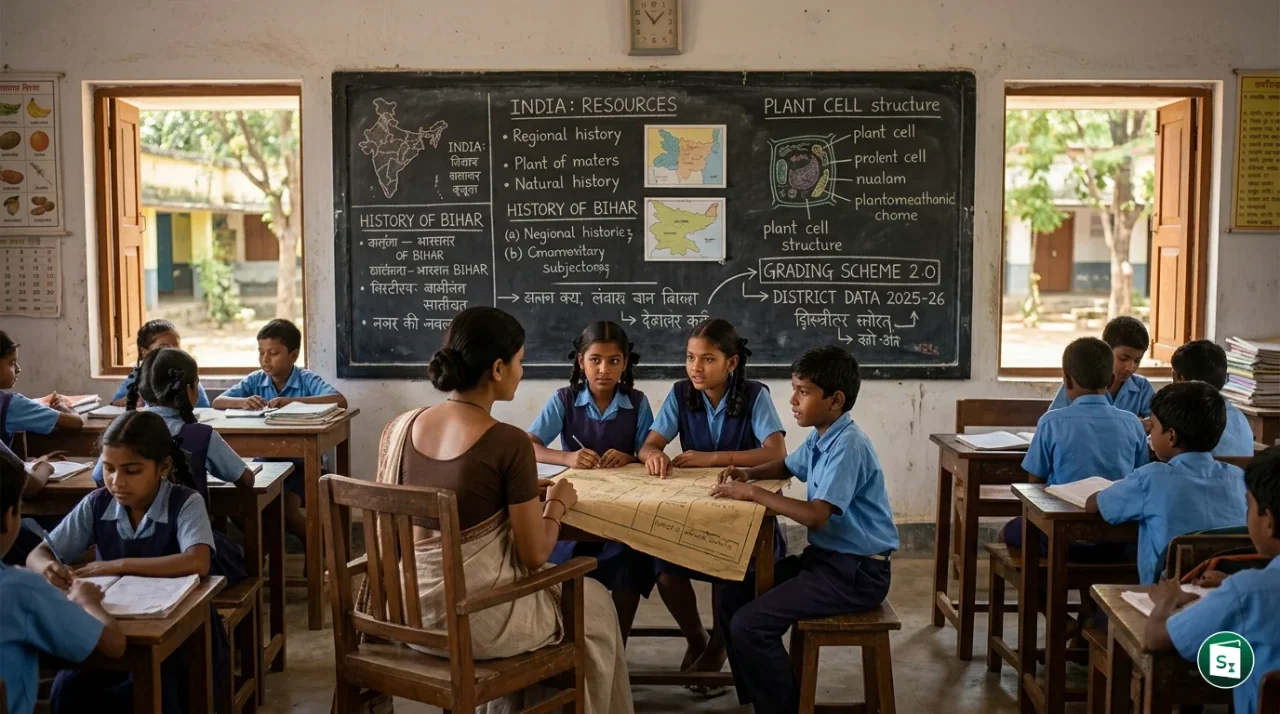
The Ministry of Education released the Performance Grading Index 2.0 for States and Union Territories (PGI-S) and the Performance Grading Index for Districts (PGI-D) for the academic year 2025-26 on 7 July 2026. The reports assess the performance of school education systems across 36 states and UTs using a comprehensive grading framework. For the second consecutive year, no state or UT achieved the highest performance grades, underscoring the distance India must still cover to meet the goals set under the National Education Policy 2020.
What Is the Performance Grading Index?
The Performance Grading Index (PGI) is a data-driven assessment framework designed by the Department of School Education and Literacy (DoSEL) under the Ministry of Education. It was first introduced in 2017 to measure and compare the performance of states and union territories in school education on a uniform scale. Unlike traditional rankings that pit states against each other, the PGI assigns performance grades based on absolute benchmarks. This approach allows multiple states to occupy the same grade band, promoting collaborative improvement rather than competitive rivalry.
The PGI framework originally evaluated states across 70 indicators carrying a total weight of 1,000 points. These indicators were grouped into two broad categories: Outcome and Governance and Management. Within these, the assessment covered five domains: Learning Outcomes, Access, Infrastructure and Facilities, Equity, and Governance Process. Data was drawn from platforms such as the Unified District Information System for Education Plus (UDISE+), the National Achievement Survey (NAS) conducted by NCERT, the Mid-Day Meal portal, and the Shagun portal.
The first PGI report was published in 2019 for the reference year 2017-18. Since then, the framework has undergone periodic revisions to remain relevant to India’s evolving education policy landscape.
PGI 2.0: A Revised Framework Aligned with NEP 2020
Over time, several indicators in the original PGI became outdated or had reached optimal targets. The framework was also criticised for being tilted heavily towards governance processes rather than quality outcomes. To address these shortcomings, the Department of School Education and Literacy revised the index structure for the 2021-22 cycle and renamed it PGI 2.0.
The revision was driven by four key objectives: to introduce more updated and quality-focused indicators, to align the framework with the National Education Policy (NEP) 2020, to monitor progress towards Sustainable Development Goal 4 (Quality Education), and to replace indicators that had already achieved their optimal benchmarks. The grading nomenclature was also overhauled to ensure uniformity with the district-level PGI.
Under PGI 2.0, the framework retained the total weight of 1,000 points but expanded the domain coverage to six domains spread across 70 indicators. The six domains are:
| Domain | Focus Area |
|---|---|
| Learning Outcomes and Quality | Student achievement and educational quality (highest weight: 240 points) |
| Access | Enrolment, retention, and transition rates |
| Infrastructure and Facilities | School buildings, classrooms, toilets, electricity, and drinking water |
| Equity | Gender parity, social group inclusion, and disabilities access |
| Governance Processes | Financial management, planning, monitoring, and policy implementation |
| Teacher Education and Training | Teacher availability, professional development, and deployment |
Data for PGI 2.0 is sourced from the UDISE+ platform, PARAKH Rashtriya Sarvekshan 2024, the PM POSHAN Portal, the PRABANDH Portal, and the Vidyanjali Portal. These sources provide verified, real-time data that feeds directly into the index, reducing reliance on self-reported submissions by states.
Key Findings of PGI-S 2025-26
The 2025-26 edition of the PGI 2.0 evaluated all 36 states and union territories on the 1,000-point framework. The grading hierarchy from highest to lowest is: Utkarsh (above 90%), Uttam-1 (81-90%), Uttam-2 (71-80%), Uttam-3 (61-70%), Prachesta-1 (51-60%), Prachesta-2 (41-50%), Prachesta-3 (31-40%), Akanshi-1 (21-30%), Akanshi-2 (11-20%), and Akanshi-3 (up to 10%).
Grade-Wise Distribution of States and UTs
| Grade | Score Range | States and UTs | Count |
|---|---|---|---|
| Utkarsh | 941-1000 | None | 0 |
| Uttam-1 | 881-940 | None | 0 |
| Uttam-2 | 821-880 | None | 0 |
| Uttam-3 | 761-820 | Chandigarh (766) | 1 |
| Prachesta-1 | 701-760 | Dadra and Nagar Haveli and Daman and Diu, Punjab, Kerala, Delhi | 4 |
| Prachesta-2 | 641-700 | Lakshadweep, Himachal Pradesh, Goa, Maharashtra, Odisha | 5 |
| Prachesta-3 | 581-640 | Andaman and Nicobar Islands, Tamil Nadu, Sikkim, Andhra Pradesh, Assam, Gujarat, Haryana, Telangana, Karnataka, Ladakh, Rajasthan, Puducherry, Uttarakhand | 13 |
| Akanshi-1 | 521-580 | Uttar Pradesh, Chhattisgarh, West Bengal, Madhya Pradesh, Bihar, Tripura, Jharkhand, Mizoram, Manipur, Jammu and Kashmir, Nagaland, Arunachal Pradesh, Meghalaya (525.7) | 13 |
| Akanshi-2 | 461-520 | None | 0 |
| Akanshi-3 | 401-460 | None | 0 |
The most notable finding is that no state or UT reached Utkarsh, Uttam-1, or Uttam-2 for the second consecutive year. Chandigarh, with 766 out of 1,000 points, became the first and only jurisdiction to enter the Uttam range in the PGI 2.0 series. At the other end, Meghalaya recorded the lowest score at 525.7, marking a significant improvement from its 2024-25 score of 448.
For the first time, all states and UTs scored above 50% of the total marks, meaning no jurisdiction fell into Akanshi-2 or Akanshi-3. The gap between the highest and lowest performers narrowed substantially from 51% in 2017-18 to 31.4% in 2025-26, indicating a gradual convergence in school education quality across the country.
Overall, 32 of 36 states and UTs improved their scores over the previous year, with an average gain of 26.4 points.
Domain-Wise Performance Highlights
The domain-wise analysis reveals a clear pattern: improvements have been driven largely by governance and infrastructure rather than by learning outcomes.
Governance Processes emerged as the primary engine of growth, contributing an average of 13.6 points to the overall gain. Chandigarh became the only state or UT to reach Uttam-1 in this domain, scoring 106 out of a possible 120 points. Meghalaya recorded the highest improvement in governance, gaining 45.1 points, followed by Lakshadweep (36.6) and Bihar (34.9).
Infrastructure and Facilities was the second largest contributor, adding an average of 6.3 points across states. Gujarat led with a gain of 22.5 points, followed by Lakshadweep (17.9) and Meghalaya (15.7). Four jurisdictions, Chandigarh, Dadra and Nagar Haveli and Daman and Diu, Delhi, and Lakshadweep, reached Uttam-2 in this domain.
Equity saw Chandigarh, Delhi, and Tamil Nadu achieving the highest Utkarsh grade, reflecting strong performance in reducing gender and social disparities in school education.
Teacher Education and Training had Kerala and Lakshadweep reaching Utkarsh, indicating sustained investments in teacher capacity and professional development.
Access saw Kerala and Puducherry achieve Utkarsh, demonstrating strong enrolment, retention, and school transition rates.
Learning Outcomes and Quality, the domain carrying the highest weight of 240 points, remained the weakest. Only Punjab reached Uttam-3 in this domain, while every other state and UT remained in lower performance bands. The report retained the PARAKH Rashtriya Sarvekshan 2024 scores for this domain in 2025-26, meaning no fresh assessment of student learning levels was factored into this year’s index.
Performance at the District Level: PGI-D 2025-26
The Performance Grading Index for Districts (PGI-D) extends the assessment to the grassroots level, measuring how effectively education policies are implemented on the ground. It evaluates 784 districts across India using a 600-point framework built on 70 indicators. These indicators are grouped into six categories: Outcomes, Effective Classroom Transaction, Infrastructure Facilities and Student Entitlements, School Safety and Child Protection, Digital Learning, and Governance Process. These categories are further divided into 11 domains including Learning Outcomes and Quality, Access Outcomes, Teacher Availability and Professional Development, Learning Management, Digital Learning, Attendance Monitoring, and School Leadership Development.
Data for PGI-D is sourced from UDISE+, PARAKH Rashtriya Sarvekshan 2024, and the PRABANDH Portal.
Key Findings at the District Level
No district achieved the highest Utkarsh grade. One district reached Uttam-1, while 19 districts achieved Uttam-2 by scoring more than 70% of the total points, up from 16 districts in 2024-25. The number of districts in Uttam-3 increased from 75 to 97, while those in Prachesta-1 declined from 332 to 325, indicating an overall upward shift.
A total of 473 districts improved their overall scores, and 89 districts moved up by at least one grade compared to the previous year. In the critical Outcome category, 462 districts showed improvement, with 50 districts advancing to a higher grade. 664 districts remained in the same grade, while 29 districts slipped by one grade.
The 19 top-performing districts in Uttam-2 included seven from Punjab, four from Delhi, three from Kerala, two from Maharashtra, along with Chandigarh, Diu, and Hamirpur in Himachal Pradesh. These districts demonstrate that strong school education outcomes are achievable across diverse geographic and administrative contexts.
The Learning Outcomes Challenge
The most persistent concern across both the state-level and district-level reports is the stagnation in learning outcomes. While states have made commendable progress in governance processes, infrastructure, and teacher training, these improvements have not translated into measurable gains in what students actually learn in classrooms.
The report itself describes learning outcomes as the ultimate goal of the index. Yet, with only one state (Punjab) reaching Uttam-3 in this domain and no state entering the top three grades, the data suggests that systemic inputs alone are insufficient. The quality of classroom instruction, the effectiveness of curriculum delivery, and the assessment of foundational literacy and numeracy remain areas requiring urgent attention.
The PGI 2.0 framework draws learning outcome data from the PARAKH Rashtriya Sarvekshan (PRS), a national survey conducted by PARAKH, the National Assessment Centre established under NCERT. For 2025-26, the index retained the PRS 2024 scores, meaning the learning outcomes component did not capture any new data. This decision means that the next edition of the PGI will be the true test of whether improvements in governance and infrastructure are beginning to move the needle on student achievement.
The narrowing gap between the best and worst performing states, from 51% to 31.4% over eight years, is a positive sign. However, the absence of any state or district at the Utkarsh level suggests that India’s school education system is still in a phase of catching up rather than leading. The challenge ahead is to shift focus from building systems to improving learning.
Key Takeaways
- The Performance Grading Index (PGI) was introduced in 2017 by the Department of School Education and Literacy (DoSEL) under the Ministry of Education to assess school education performance across states and UTs.
- The PGI 2.0 framework, revised in 2021-22 to align with NEP 2020, evaluates states on 1,000 points across 70 indicators and six domains: Learning Outcomes, Access, Infrastructure, Equity, Governance, and Teacher Education.
- Chandigarh was the top performer in 2025-26 with 766 points, becoming the only state or UT to enter the Uttam-3 grade. No state or UT achieved Utkarsh, Uttam-1, or Uttam-2 for the second consecutive year.
- For the first time, all 36 states and UTs scored above 50%, with no jurisdiction falling into the lowest Akanshi-2 or Akanshi-3 bands.
- The performance gap between the highest and lowest scoring states narrowed from 51% in 2017-18 to 31.4% in 2025-26.
- At the district level, 19 districts reached Uttam-2 in PGI-D 2025-26, up from 16 in the previous year, while no district attained Utkarsh.
- Learning Outcomes remained the weakest domain, with only Punjab reaching Uttam-3. The index retained PARAKH Rashtriya Sarvekshan 2024 scores for this domain, with no fresh assessment included for 2025-26.