
NITI Aayog released the first volume of its report “Key Sectors to Position India as a Global Manufacturing Hub” on 13 August 2026, prepared with CRISIL Intelligence as the knowledge partner. From an initial universe of 62 sectors, the study shortlists 12 sectors where India can realistically aim for global leadership by 2047, with detailed roadmaps for four priority sectors in this volume. The report uses a disciplined, four phase, data driven methodology to shift the focus from simply expanding output to building scale, value addition and deeper integration with global value chains.
What the NITI Aayog Report Is About
NITI Aayog, which stands for National Institution for Transforming India, is the apex public policy think tank of the Government of India. It was established on 1 January 2015 through a Cabinet resolution, replacing the Planning Commission that had been set up on 15 March 1950. Headquartered in New Delhi, it is chaired by the Prime Minister and its Vice Chairperson at the time of the report’s release was Ashok Kumar Lahiri. The Aayog released the report through its Industry and Foreign Investment Division.
The report provides a data driven assessment of India’s manufacturing landscape at a time when the sector accounts for about 17.5 percent of India’s gross value added (GVA) in FY26, with its share stuck in a narrow range of 16 to 18 percent for nearly two decades. India is currently the fifth largest manufacturer in the world but contributes only about 3 to 3.2 percent to global manufacturing output, which is estimated at $17.6 trillion, compared with China’s share of about 32 percent. The report places this gap in the context of India’s Viksit Bharat @2047 vision to become a $30 trillion economy by 2047 and achieve developed nation status by the centenary of Independence.
The broader policy backdrop includes Make in India, launched on 25 September 2014, and its expansion Make in India 2.0 covering 27 sectors, the Production Linked Incentive (PLI) scheme with an outlay of ₹1.97 lakh crore across 14 strategic sectors, and the National Manufacturing Mission (NMM) announced in the Union Budget 2025 to 26. All these initiatives aim to raise manufacturing’s share of GDP toward 25 percent, strengthen self reliance under Atmanirbhar Bharat, and move India from low value assembly to high value, technology intensive production.
CRISIL, which stands for Credit Rating Information Services of India Limited, now operates as CRISIL Intelligence for research. It drew on its coverage of more than 75 traditional, sunrise and PLI sectors to support the analysis. The core message of Volume One is that India has strong fundamentals, including a large domestic market, a median age of around 28 years, and growing global interest in diversified supply chains, but these alone will not deliver global leadership without scale, productivity, technology depth and resilient supply chains.
The 12 Sectors Chosen for Global Leadership
After screening 62 sectors, the report identifies 12 sectors where India can realistically aspire to lead globally. The sectors span employment intensive industries, foundational inputs, and advanced and strategic technologies. Together they are meant to capture export strength, job creation, and technological capability.
| Sector | Broad Category | Why It Matters for India |
|---|---|---|
| Electronics | Advanced technology | Large domestic demand, global value chain integration, import substitution |
| Telecom Equipment | Advanced technology and digital infrastructure | Second largest telecom market, 5G and networking growth, strategic autonomy |
| Solar Photovoltaic (PV) | Clean energy and strategic future | Energy transition, domestic demand for 280 GW solar target by 2030 |
| Pharmaceuticals | Health and technology intensive | Third largest by volume globally, 20 percent of world generic supply, strong R and D base |
| Chemicals | Foundational industrial input | Sixth largest producer globally, supplies agriculture, pharma, textiles and construction |
| Automobiles | Employment and export intensive | Large domestic market, growing electric vehicle and component ecosystem |
| Defence and Drones | Strategic sector | Self reliance, export potential, dual use technology |
| Steel | Core industrial input | Second largest steel producer, infrastructure and construction demand |
| Capital Goods | Industrial machinery | Supports manufacturing depth, productivity and self sufficiency |
| Textiles | Employment intensive | Second largest employer after agriculture, 45 million livelihoods, MSME heavy |
| Food Processing | Agro linked and employment intensive | Value addition to farm output, rural income, export diversification |
| Leather and Footwear | Labour intensive and export oriented | Low capital intensity, high job creation, global demand |
This volume examines the first four in detail, which are chemicals, textiles, telecom and networking equipment, and solar PV manufacturing. The remaining eight sectors will be covered in subsequent volumes. For each sector, the report assesses market potential, raw material availability, technology readiness, financial viability, infrastructure needs, and India’s current position in the value chain.
Four High Potential Sectors in Focus: Volume One
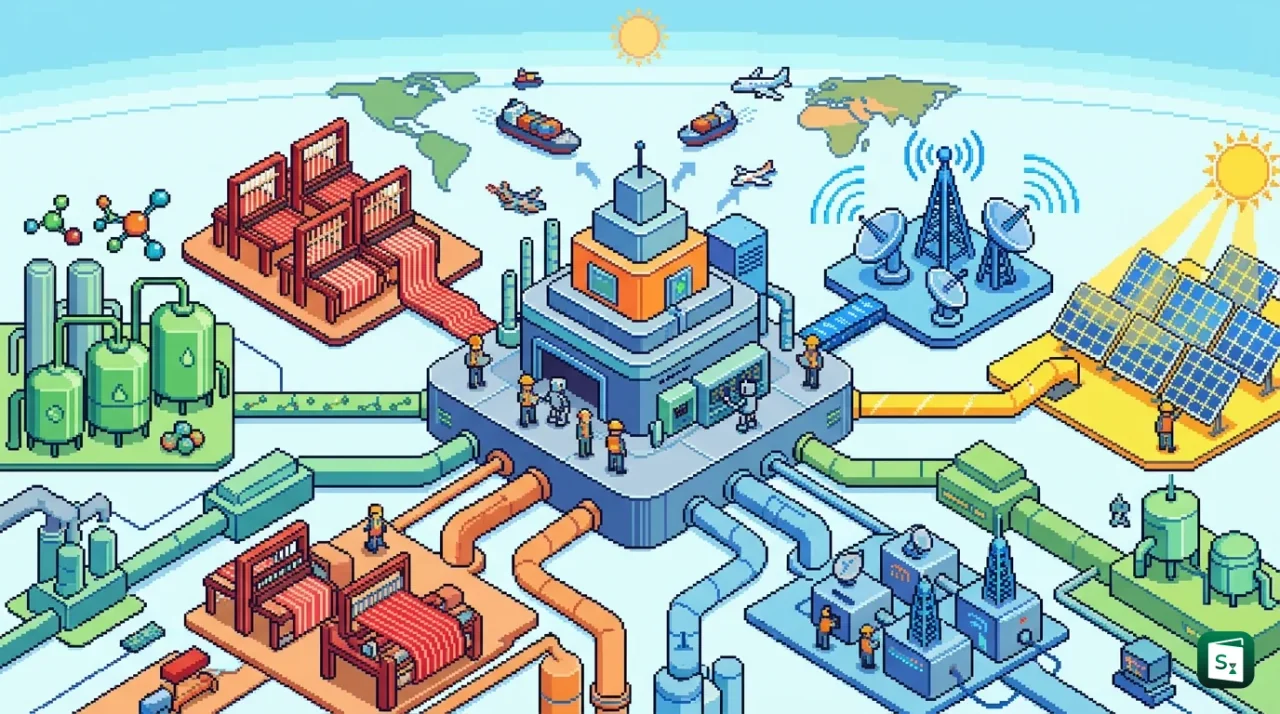
Volume One argues that the four chosen sectors represent distinct but complementary pathways. Chemicals anchors industrial depth, textiles delivers mass employment, telecom equipment builds digital capability, and solar PV secures the clean energy transition. Each faces a common set of constraints, which include heavy import dependence, fragmented supply chains, limited domestic value addition, and skill and technology gaps.
Chemicals: Moving Up the Value Chain
The chemicals industry contributes about 7 percent to India’s GDP and is the sixth largest producer in the world and third largest in Asia. The domestic chemicals market was valued at $220 billion in 2023 and is projected to reach $400 to $450 billion by 2030 and $850 billion to $1,000 billion by 2040. Yet India’s share in global chemicals consumption is only 3 to 3.5 percent, and the sector ran a trade deficit of about $31 billion due to dependence on imported feedstock and intermediates.
The problem lies upstream. A large share of basic building blocks such as propylene, ethylene, benzene and butadiene is diverted to bulk polymers rather than to higher value intermediates. For example, about 95 percent of propylene in India goes into polypropylene, compared with about 70 percent globally, and 75 percent of ethylene goes into polyethylene, compared with 63 percent globally. Key intermediates such as phenol, methanol, acetic acid, styrene and vinyl acetate monomer are imported in large volumes.
Infrastructure is another gap. The Petroleum, Chemicals and Petrochemical Investment Regions (PCPIRs) policy, launched in 2007, envisaged integrated clusters of about 250 sq. km each at locations such as Dahej in Gujarat, Visakhapatnam in Andhra Pradesh, Paradip in Odisha, and Cuddalore in Tamil Nadu, each anchored by a refinery or petrochemical complex. Progress has been uneven due to land, port infrastructure, utilities and clearances.
The report recommends strengthening domestic feedstock production, promoting backward integration, upgrading specialised port infrastructure, creating an overarching framework for PCPIRs with shared utilities, promoting joint ventures and technology transfer, and using Viability Gap Funding (VGF) and Free Trade Agreements (FTAs) that protect domestic industry while improving market access. Priority products identified include phenol, methanol and acetic acid.
Textiles: Employment and Export Powerhouse
Textiles remains one of India’s most employment intensive and export oriented sectors. It contributes about 2 to 2.3 percent to GDP, about 11 percent to manufacturing GVA, about 13 percent to industrial production, and about 8 to 12 percent to merchandise exports. It provides livelihoods to more than 45 million people, making it the second largest employer after agriculture, and accounts for nearly 80 percent of MSME capacity in the sector, spread across fragmented clusters in powerlooms, handlooms and garments.
India exported textile products worth $37.7 billion in FY25 and $34.4 billion in FY24, accounting for about 4.1 percent of global textile and apparel exports and ranking as the sixth largest exporter. The United States and the European Union together take about 47 to 50 percent of these exports.
The constraints are productivity and scale. Labour productivity was recorded at 7.9 GDP per working hour in India, compared with 15.4 in China and 9.8 in Vietnam. Most weaving units are small, geographically dispersed, and lack scale and technology. The sector also faces an inverted duty structure in man made fibres (MMF), where import duties on raw materials are higher than on finished goods, raising costs for domestic producers. Quality control orders on fibres such as polyester have raised input costs by 10 to 15 percent relative to competitors.
The report calls for a strategic shift toward man made fibre led growth to achieve $100 billion in textile exports by 2029 to 30, with larger weaving capacities, modernisation of Micro, Small and Medium Enterprises (MSMEs), integrated textile parks under schemes like PM MITRA (PM Mega Integrated Textile Region and Apparel Park), apprenticeship and industry academia skilling, affordable and dignified accommodation for migrant workers near clusters, and balanced FTAs to improve market access. It also highlights technical textiles, sustainable textiles, and premium Indian weaves as growth avenues.
Telecom and Networking Equipment: From Assembly to Value Addition
India is the second largest telecommunications market in the world, with more than 1.2 billion subscribers, about 85 percent telecom penetration, and nearly 75 percent internet usage. The National Telecom Policy 2025 targets doubling the sector’s contribution to GDP, doubling exports of telecom products and services, creating one million jobs, and raising investment and research spending by 2030.
Yet domestic manufacturing remains shallow. Annual exports of telecom equipment were only $0.6 to $1 billion between 2020 and 2024, against imports of $4 to $5 billion, and more than 80 percent of critical components are sourced from China. Localisation is particularly low in high value segments such as 4G and 5G radio access equipment. Nearly 98 percent of demand comes from private telecom service providers, limiting assured offtake for domestic firms.
The report states that an end to end domestic value chain is not feasible or desirable because the industry operates through global collaborative production. The priority should be deeper local value addition rather than simply increasing domestic production volumes.
Recommendations include incentivising private operators to procure domestic radio infrastructure, building integrated industrial clusters, expanding testing and certification capacity, expanding high potential export segments, and supporting Very Large Scale Integration (VLSI) and fabless semiconductor design through institute manufacturer partnerships, joint ventures and intellectual property led manufacturing.
Solar Photovoltaic Manufacturing: Powering Energy Transition
Solar PV is central to India’s energy transition and clean technology leadership. India reached 106 GW of installed solar capacity by March 2025 and needs to add about 174 GW more to reach its target of 280 GW by 2030. The domestic PV market was estimated at ₹32,400 crore or about $3.7 billion in FY24, and is projected to grow at 17 to 20 percent annually between FY23 and FY30, driven by utility scale projects, rooftop solar, open access, and green hydrogen linked demand.
Manufacturing capacity has expanded sharply. Module capacity rose from 2.3 GW in 2014 to 91 GW in early 2025 and crossed 100 GW by August 2025 under the Approved List of Models and Manufacturers (ALMM), which was introduced by the Ministry of New and Renewable Energy (MNRE) through an order in January 2019 and first published in March 2021 with 8.2 GW. The number of ALMM listed manufacturers grew from 21 in 2021 to 100 operating 123 units in 2025. Cell capacity stood at about 25 to 29 GW and wafer capacity at about 5.3 GW, while polysilicon remained at 3.3 GW, leaving India heavily dependent on imports from China for upstream inputs and for manufacturing machinery.
Other gaps include low research intensity, with Indian firms investing less than 1 percent of revenue in R and D compared with a global average of 3 percent, and export concentration, with the United States accounting for 97 percent of India’s solar module exports between 2019 to 20 and 2025 to 26.
The report recommends creating a dedicated solar R and D fund, providing greater access to Anusandhan National Research Foundation (ANRF) funding, building clean tech clusters with shared infrastructure, promoting joint ventures beyond China, moving upstream into polysilicon and wafers, diversifying export markets, and promoting industry led skilling with performance linked support. The PLI scheme for high efficiency solar modules, which aims to add 65 GW per annum of integrated capacity with an investment of about ₹94,000 crore, is a key lever for this upstream expansion.
How the 12 Sectors Were Selected: The Four Phase Methodology
The study followed a structured four phase approach designed to ground aspiration in evidence.
Phase One screened 62 sectors using a relative attractiveness framework with four equally weighted parameters, each given 25 percent weightage. The parameters were domestic market size, global market size, domestic growth projection up to FY30, and global growth projection up to FY30. Each sector’s size was compared with the median size across all 62 sectors to create a median multiplier, and a cumulative score was mapped on a market size growth matrix. Sectors falling in the high attractiveness quadrants were shortlisted.
Phase Two conducted a deeper, three pronged assessment of each shortlisted sector across strategic alignment, operational and financial viability, and value chain positioning. Strategic alignment checked raw material dependence, geopolitical risks, employment intensity and fit with national priorities. Financial viability examined profitability, capital intensity, cost structures and ability to attract private capital without continuous government support. Value chain positioning mapped India’s current role in global value chains and scope for deeper, higher value participation.
Phase Three benchmarked each sector against two leading manufacturing nations that exemplify success in that sector. Comparisons were chosen to provide contrasting models, such as a capital and technology intensive model like South Korea in electronics and a labour and scale driven model like Vietnam in apparel, so that lessons on policy, clustering, technology and firm linkages could be adapted to India.
Phase Four integrated these findings with extensive industry consultations through stakeholder meetings, surveys and case studies. Insights from secondary research, international best practices and on ground feedback were combined to develop actionable recommendations covering production factors, regulation, taxation, trade agreements, technology and implementation strategies. The report notes that consultations identified policy consistency, infrastructure and supply chain integration, innovation, market access and execution as cross cutting areas requiring attention.
Why Manufacturing Scale Matters Now
India’s global manufacturing share of about 3 percent has persisted even as services grew faster. Without accelerated technology adoption, projections suggest manufacturing’s share of GDP could fall to 9 to 10 percent by 2035, whereas full adoption of Industry 4.0 technologies such as artificial intelligence, robotics, digital twins and advanced materials could raise it to about 25 percent and add $1 trillion to manufacturing GDP by 2047 alongside more than 100 million skilled jobs.
Three forces make scale urgent. First, global supply chains are diversifying as companies seek alternatives to concentrated production bases, opening a window for India. Second, domestic demand is rising with urbanisation, infrastructure building and the energy transition, which will raise demand for steel, cement, chemicals, electronics and clean technology manyfold. Third, high import dependence exposes the economy to price volatility and supply disruptions, as seen in telecom components, solar upstream inputs, and chemicals feedstock.
The report links manufacturing success to the wider vision of Viksit Bharat 2047, which aims for a developed, high income economy by 2047, and to related goals such as Net Zero by 2070. Historical experience also informs the analysis, with brief case studies of Japan’s post war capital intensive boom, China’s export led surge from 1980 to 2011 when it became the world’s largest manufacturer, and Vietnam’s labour intensive integration into apparel and electronics value chains.
Cross Cutting Challenges and the Way Forward
Across all four sectors, the report identifies six common hurdles, which are import dependence on critical inputs, fragmented supply chains, infrastructure and logistics gaps, limited domestic value addition, technology constraints, and skill shortages.
The way forward is not a single policy but a coordinated, differentiated approach. Policies must vary by sector because constraints on raw materials, technology, market access and financing differ sharply. Yet several common actions run through all chapters.
First, build industrial clusters and integrated parks with shared utilities, efficient approvals, and common infrastructure to achieve economies of scale and scope. Jurong Island in Singapore, with $40 billion in investment and more than 100 chemical companies on a single island, and similar models in chemicals, are cited as examples.
Second, reduce import dependence through targeted incentives, viability gap funding, domestic feedstock expansion and backward integration.
Third, deepen value addition by moving beyond assembly to higher value segments. In telecom this means components and design, in solar it means polysilicon and wafers, in chemicals it means intermediates and speciality chemicals, and in textiles it means man made fibres and technical textiles.
Fourth, invest in technology and skills, including VLSI and fabless design, joint ventures for technology transfer, R and D funds, and apprenticeship based workforce programmes.
Fifth, strengthen global market links through diversified exports, government to government frameworks, and FTAs that balance market access with protection for domestic industry.
Finally, ensure long term policy consistency and centre state coordination with active roles for industry, academia and financial institutions. The report stresses that sustained success in leading manufacturing nations came from consistent policies, clustering, infrastructure readiness, targeted incentives, and strong links between domestic firms and global markets, not from one time interventions. It also notes that most new investment must come from the private sector, with government acting to remove impediments and create profitable opportunities.
Key Takeaways
- NITI Aayog released Volume One of the report “Key Sectors to Position India as a Global Manufacturing Hub” on 13 August 2026 with CRISIL Intelligence as the knowledge partner.
- The study screened 62 sectors and shortlisted 12 sectors for global leadership by 2047, which include electronics, telecom equipment, solar PV, pharmaceuticals, chemicals, automobiles, defence and drones, steel, capital goods, textiles, food processing, and leather and footwear.
- Volume One details four high potential sectors, which are chemicals, textiles, telecom and networking equipment, and solar PV manufacturing, while the remaining eight will be covered in later volumes.
- Selection followed a four phase methodology covering market size and growth scoring, three pronged assessment on strategic alignment and viability and value chains, benchmarking against two leading nations per sector, and industry consultations.
- India is the fifth largest manufacturer but accounts for only about 3 percent of $17.6 trillion global manufacturing output, with manufacturing at 17.5 percent of GVA in FY26, broadly stagnant at 16 to 18 percent for two decades.
- NITI Aayog, the National Institution for Transforming India, was established on 1 January 2015 replacing the Planning Commission (15 March 1950) and is headquartered in New Delhi.