

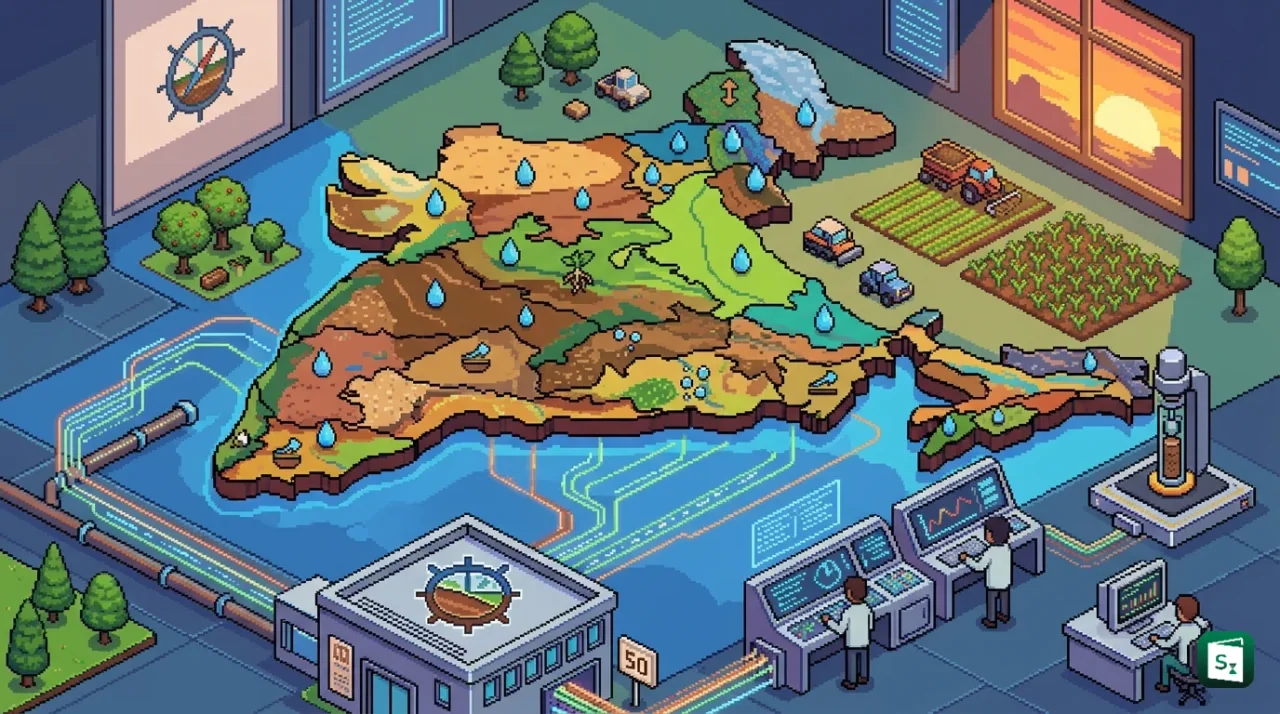
The National Bureau of Soil Survey and Land Use Planning (NBSS&LUP) has launched India’s first Soil Texture Map of India at its 50th Foundation Day celebrations in Nagpur, Maharashtra. The digital map, first released on 16 July 2026 on the 98th Foundation Day of the Indian Council of Agricultural Research (ICAR) and showcased during the Golden Jubilee on 23 August 2026, provides soil texture data at hectare-level resolution across the country. By revealing the proportion of sand, silt and clay in every hectare, it gives farmers and planners a precise tool to choose crops, plan irrigation and use land more scientifically.
What Is Soil Texture?
Soil texture is the relative proportion of sand, silt and clay particles in the mineral part of the soil. It is a basic physical property and, unlike chemical properties that can be changed with fertilisers, it is largely permanent and set by the parent rock and weathering history.
The three separates are defined by particle size. Sand particles are the largest, with diameters between 0.05 mm and 2 mm, and feel gritty. Silt particles are intermediate, between 0.002 mm and 0.05 mm, and feel smooth and silky. Clay particles are the finest, less than 0.002 mm, with a sheet-like structure and very large surface area.
Because of these size differences, texture controls how soil behaves. It influences water-holding capacity, how fast water drains or infiltrates, how well air moves to roots, how easily roots can penetrate, and how well nutrients are held. It also affects workability, erosion risk and the soil’s ability to support different crops.
How Is Soil Texture Determined and Classified?
Soil texture is not guessed, it is measured. Understanding how it is measured helps explain why a national map at hectare level is a technical advance.
How Soil Texture Is Measured
In the field, scientists use the simple feel method, where moist soil is rubbed between thumb and finger to assess grittiness, smoothness and stickiness. In the laboratory, the more exact particle size analysis (PSA) is used, typically by the hydrometer method or pipette method, which separates and weighs the sand, silt and clay fractions. Modern digital mapping also uses remote sensing and spectral libraries to estimate texture over large areas, calibrated with field samples.
The Soil Texture Triangle and USDA Classification
Once the percentages of sand, silt and clay are known, the soil is named using the soil texture triangle, a diagram adopted from the United States Department of Agriculture (USDA) classification. The USDA system recognises 12 major texture classes, including sand, loamy sand, sandy loam, loam, silt loam, silt, sandy clay loam, clay loam, silty clay loam, sandy clay, silty clay and clay. The name reflects the dominant fraction, for example, a sandy clay has high sand and clay, while a loam has a balanced mixture of about 40% sand, 40% silt and 20% clay and is often considered ideal for farming because it balances drainage and retention.
| Particle Type | Size Range | Key Character |
|---|---|---|
| Sand | 0.05 to 2 mm | Large grains, rapid drainage, low nutrient and water retention, good aeration |
| Silt | 0.002 to 0.05 mm | Medium grains, smooth feel, moderate to good water and nutrient holding |
| Clay | Less than 0.002 mm | Very fine, high surface area, high water and nutrient holding, slow drainage, prone to waterlogging |
Soil Texture vs Soil Structure
Soil texture and soil structure are often confused but they mean different things. Texture refers to the proportion and size of individual particles, and it cannot be changed easily. Soil structure refers to how those particles are arranged into aggregates or clumps, and how pore spaces are organised. Structure can be improved with organic matter, tillage and biological activity, while texture remains largely fixed. Good structure can partly improve the behaviour of a poor texture, for example by helping a clay soil drain better, but it cannot turn clay into sand.
What Is the Soil Texture Map of India?
The Soil Texture Map of India is the first national digital map that shows the distribution of sand, silt and clay proportions for every hectare of the country. It was developed by ICAR-NBSS&LUP, Nagpur and was released by the Union Minister for Agriculture and Farmers Welfare and Rural Development, Shri Shivraj Singh Chouhan, during the 98th Foundation Day of ICAR on 16 July 2026. The map was then highlighted as a flagship achievement during the Golden Jubilee celebrations of NBSS&LUP on 23 August 2026 in Nagpur, which was attended by Dr M. L. Jat, Secretary of the Department of Agricultural Research and Education (DARE) and Director General of ICAR, and Dr A. K. Nayak, Deputy Director General for Natural Resource Management.
Unlike earlier soil maps that were mostly at 1:1 million or 1:250,000 scale and gave generalised information for large regions, this new product is a high-resolution digital raster that can be queried village by village and field by field. It provides digitised soil classification data that can be overlaid with other layers such as terrain, rainfall and land use.
The map is part of a larger shift toward digital soil mapping (DSM), where legacy field data, satellite observations and machine learning are combined to produce continuous, seamless maps rather than isolated survey reports.
How Was the Map Prepared?
NBSS&LUP used a hybrid approach that combines traditional soil science with modern geospatial and artificial intelligence tools.
Field studies and legacy data formed the foundation. Scientists drew on decades of soil survey reports, profile observations from state-level soil series mapped by NBSS&LUP since the Soil Resource Mapping Programme of 1986, and fresh ground sampling that recorded texture at known locations with GPS coordinates.
Remote sensing and satellite imagery provided the spatial coverage. Multispectral data from platforms such as Sentinel-2 and terrain variables derived from digital elevation models (DEM) helped capture patterns in vegetation, moisture, landform and parent material that correlate with soil texture.
Artificial intelligence and machine learning tied the two together. Models such as Random Forest, Cubist and support vector regression were tested, and Random Forest was found to perform best for Indian conditions. The models were trained on about 80 percent of the samples and validated on the remaining 20 percent selected by a conditioned Latin hypercube method to ensure representation of national variability. Data from neighbouring districts were also included to avoid abrupt changes at state boundaries, creating a seamless national mosaic.
Environmental covariates used in modelling included climatic variables such as annual mean temperature, rainfall and seasonality, topographic indices such as slope, valley depth and wetness index, and long-term vegetation indices like NDVI. This approach allowed NBSS&LUP to predict sand, silt and clay fractions across more than 328 million hectares of national territory.
Why Does Soil Texture Matter for Agriculture and Land Use?
Soil texture is not an abstract property, it directly shapes farm-level decisions and policy choices.
Water and irrigation. Sandy soils have large pores and drain quickly, so they need frequent but lighter irrigation. Clay soils have many fine pores, hold more total water but hold it tightly, so water moves slowly and waterlogging is a risk. Loamy and silty soils offer the best balance and hold the most plant-available water. Knowing this helps schedule irrigation, design drainage and estimate water-holding capacity and infiltration rates.
Aeration and root growth. Texture determines pore size and therefore air movement. Sandy soils are well aerated and allow easy root penetration but are unstable. Clay soils can become compact and restrict root growth and microbial activity when wet. Silt and loam provide a friable structure that supports healthy root expansion.
Nutrients and fertility. Clay particles have high surface area and can hold nutrients and exchange cations, while sand holds almost none. Texture therefore affects cation exchange capacity, nutrient retention, fertiliser response and organic matter storage.
Crop suitability. Different crops prefer different textures. Root and tuber crops such as carrot, radish and groundnut prefer well-drained sandy loams. Rice tolerates heavy clays that can hold standing water. Wheat, maize, soybean, pulses and many vegetables perform best on loams and silt loams. The map allows crop suitability assessment to be done at hectare and village level rather than relying on district averages.
Policy and planning. With an average farm size of about 1 hectare in India and wide variation in soil over short distances, precise information is vital. The map helps government agencies carry out village-level agricultural planning, land-use planning, soil conservation and targeted resource allocation, and move from generic advisories to location-specific recommendations.
Understanding the Broader Soil Mapping Effort in India
The texture map is not an isolated product. It sits within a long-term national effort to digitise soil information.
From Soil Depth Map to Soil Texture Map
In November 2024, NBSS&LUP released India’s first Soil Depth Map, which showed the thickness of the soil profile from surface to the underlying hard layer, ranging from about 6 cm to 250 cm across the country. Depth and texture are complementary. Depth tells how much volume is available for roots and water storage, while texture tells what that volume can hold and how it will behave. Together they allow better estimation of available water capacity, land capability and land irrigability.
The BHOOMI Geoportal and Unified National Soil Information System
All these products are being brought together on BHOOMI Geoportal (bhoomigeoportal-nbsslup.in), the knowledge gateway developed by NBSS&LUP. Under the National Geospatial Policy 2022, the Department of Agricultural Research and Education (DARE) has been notified as the nodal department for geospatial data theme Soil, and ICAR-NBSS&LUP as the nodal organisation. NBSS&LUP is now working with ICAR institutes and State Agricultural Universities to build a Unified National Soil Information System (UNSIS), which will integrate data from the Soil Resource Database at 1:1 million, 1:250,000, 1:50,000 and 1:10,000 scales, benchmark soils, fertility maps, agro-ecological regions and land degradation assessments into a single searchable system.
The system also links to services such as the National Soil Spectral Library, Indian National Soil Grid, land management units, crop suitability maps for 26 major crops and watershed planning tools, making soil intelligence accessible to planners and researchers rather than remaining scattered in printed reports.
This effort complements the Soil Health Card Scheme, launched on 19 February 2015 at Suratgarh, Rajasthan, with the slogan “Swasth Dharaa, Khet Haraa”. While Soil Health Cards give farmer-specific nutrient advice from 12 parameters including nitrogen, phosphorus, potassium, organic carbon, pH and micronutrients, the new texture and depth maps provide the underlying physical framework that explains why two neighbouring fields may respond differently to the same fertiliser.
About NBSS&LUP and Its Role in Soil Survey
The National Bureau of Soil Survey and Land Use Planning was first created as the All-India Soil Survey Scheme in 1956, expanded in 1959 as the All-India Soil and Land Use Survey Organisation (AIS&LUS), and after bifurcation in 1969 came under the Indian Council of Agricultural Research (ICAR). It was reconstituted as a Directorate in 1973 and given its present status as a Bureau in 1976, with headquarters shifted from New Delhi to Amravati Road, Nagpur, Maharashtra in June 1978.
ICAR itself is the apex body for agricultural research and education in India. Established originally as the Imperial Council of Agricultural Research on 16 July 1929 under the Societies Registration Act, 1860, following the report of the Royal Commission on Agriculture, it functions as an autonomous organisation under DARE, Ministry of Agriculture and Farmers Welfare, is headquartered in New Delhi, and today coordinates a network of 113 institutes and 74 agricultural universities. NBSS&LUP is one of its 14 Natural Resource Management institutes.
The Bureau’s mandate covers soil survey, pedology, soil correlation and classification, remote sensing applications, land evaluation, land degradation assessment and land-use planning. It operates through five regional centres at Bengaluru, Delhi, Kolkata, Jorhat and Udaipur, in addition to its headquarters. Its recent work has focused on developing district-level resource databases, land resource inventories on 1:10,000 scale for block-level planning, and research on soil organic carbon, soil hydraulic properties and climate-resilient land-use plans created for aspirational districts.
ICAR Director General Dr M. L. Jat noted at the 50th Foundation Day that the soil database and information system built by NBSS&LUP now forms a crucial foundation for crop improvement, decision-support systems and sustainable agriculture.
The Way Forward
The next step for NBSS&LUP is the development of high-resolution water retention and absorption capacity maps, with initial focus on Maharashtra and southern India, where texture and depth together determine how long rainwater can be stored in the root zone. Such maps will be vital for drought management, micro-irrigation planning and climate adaptation in rainfed regions.
Over time, the integration of texture, depth, fertility, organic carbon and hydraulic properties into UNSIS and BHOOMI is expected to support precision agriculture, site-specific nutrient management, agro-ecological zoning and land degradation neutrality goals. For this potential to be realised, continuous ground validation, open access to village-level data, training of extension workers to interpret texture information, and linkage with existing advisories such as Soil Health Cards and Kisan services like the BHOOMI mobile apps for soil health and crop suitability will be important.
The move from printed soil reports to an interactive hectare-level map signals how traditional survey science and geospatial intelligence can together strengthen India’s ability to manage its limited soil and water resources.
Key Takeaways
- India’s first Soil Texture Map of India was developed by ICAR-NBSS&LUP, Nagpur and released on 16 July 2026, showcased during its 50th Foundation Day on 23 August 2026 in Nagpur.
- Soil texture is the relative proportion of sand (0.05 to 2 mm), silt (0.002 to 0.05 mm) and clay (less than 0.002 mm) and controls water-holding capacity, drainage, aeration and crop suitability.
- The map provides hectare-level digitised soil classification using field surveys, remote sensing, satellite imagery and artificial intelligence (Random Forest).
- The USDA system classifies soils into 12 texture classes using the soil texture triangle, with loam (about 40% sand, 40% silt, 20% clay) considered ideal for many crops.
- NBSS&LUP was accorded Bureau status in 1976, shifted to Nagpur in June 1978, and is one of 14 Natural Resource Management institutes under ICAR (established 16 July 1929, New Delhi).
- The texture map follows India’s first Soil Depth Map released in November 2024 and is hosted on the BHOOMI Geoportal, which will be integrated into the Unified National Soil Information System (UNSIS) under the National Geospatial Policy 2022.