

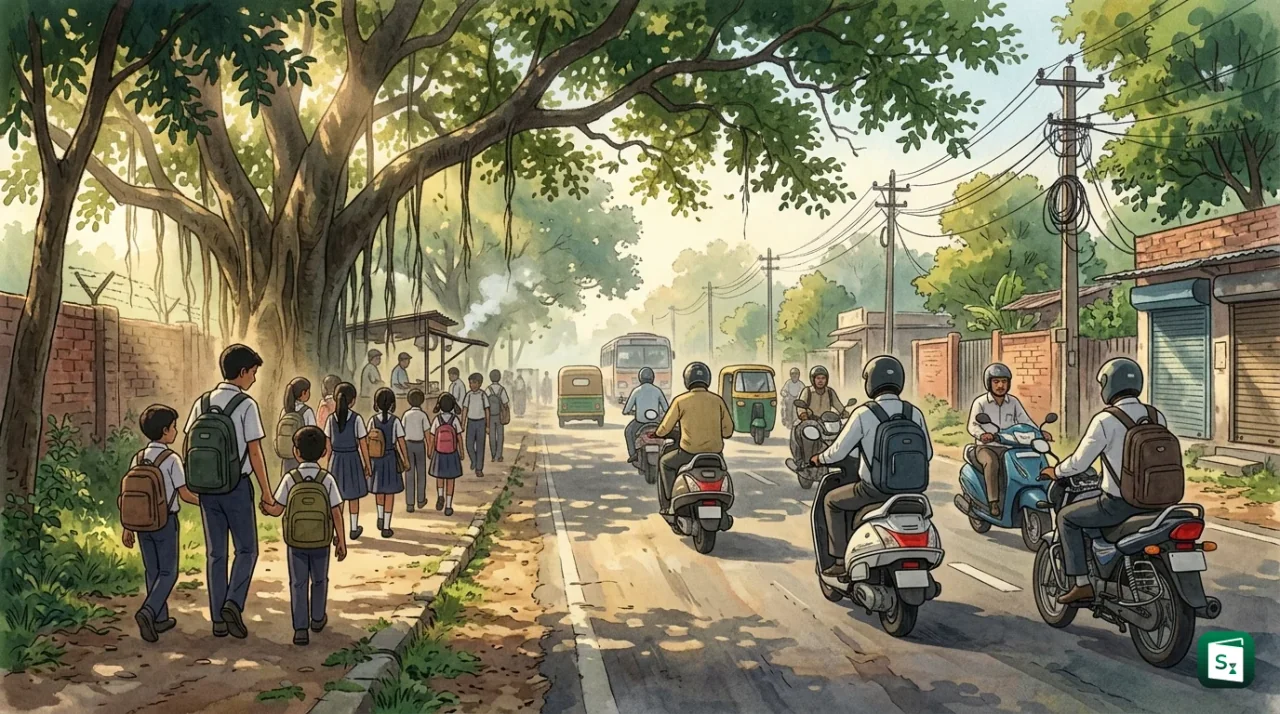
The National Statistics Office released the key findings of India’s first ever National Household Travel Survey on 5 October 2026, covering travel during July 2025 to June 2026. The survey shows that 66.4 percent of students aged 6 years and above travel more than 1 km daily to study, while 42.6 percent of workers depend on two wheelers to reach fixed workplaces. It gives India its first nationwide benchmark of how people move, how much they spend and how long they take.
What Is the National Household Travel Survey?
The National Household Travel Survey is India’s first nationwide study of daily household travel behaviour, conducted by the National Statistics Office from July 2025 to June 2026. It records trips of 1 km or more for work, study, social, tourism and other purposes, along with mode, time, distance and cost.
A household travel survey is a systematic interview of families about their regular movement. The National Household Travel Survey applies this idea at national scale. It asks who travels, why they travel, which vehicle or mode they use, how far they go and how much they pay.
The survey uses a few clear concepts. Travel means a trip of 1 km or more. Shorter walks to a nearby shop do not count. Primary mode of travel means the mode used for the longest distance in a trip. If a person walks to a bus stop and then takes a bus for a longer stretch, the bus is the primary mode.
The National Statistics Office also defined a travel day as the period from 3 AM on one calendar day to 2:59 AM on the next day. Trips that keep a person away from home for up to 24 hours are within travel day trips. Trips that keep a person away for more than 24 hours and cover at least 50 km are overnight trips. These definitions keep data comparable across states and seasons.
Scale and Coverage of the First Ever Survey
The National Statistics Office conducted the National Household Travel Survey from July 2025 to June 2026 across all states and union territories. A full year of field work captures seasonal differences. Farm work, school terms, festivals and weather change travel patterns through the year.
The scale is very large. Survey teams visited 14,274 villages and 10,377 urban blocks. They collected information from 4,92,023 households covering 20,34,371 persons. This size makes the results reliable at national level and for rural and urban breakups.
The survey looked at four broad areas. It measured mobility, which is the share of people who travel regularly. It measured duration and peak hours. It measured expenditure on commuting. It also measured overnight and non work travel. In addition, the survey meets specific data needs of the Ministry of Railways on passenger movement and public transport use.
How Students Travel to School and College
Nearly two thirds of students travel a meaningful distance every day. Among students aged 6 years and above, 66.4 percent undertake a within travel day trip of at least 1 km to attend their basic course institution. The share is 65.6 percent in rural areas and 68.1 percent in urban areas. Students in the age group of 15 to 29 years show the highest participation, with 79.1 percent in rural India and 73.3 percent in urban India travelling daily.
Walking is the backbone of student travel. Feet carry the largest share. Buses serve as the second pillar, followed by bicycles. Auto rickshaws and two wheelers matter more in cities, where distances are longer and family vehicle ownership is higher.
| Primary Mode | Share Among Travelling Students |
|---|---|
| Walking | 37.0 percent |
| Bus | 29.5 percent |
| Bicycle | 15.8 percent |
| Auto rickshaw | 10.5 percent (14.4 percent in urban areas) |
| Two wheeler | 6.7 percent (11.5 percent in urban areas) |
The pattern changes with age. Among children aged 6 to 14 years, 47.3 percent walk to school. Among youth aged 15 to 29 years, walking drops to 22.2 percent while bicycle use rises to 21.4 percent and bus use rises to 31.0 percent. Older students travel farther for higher education and depend more on cycles, buses and shared autos.
How Workers Commute and Why Two Wheelers Dominate
More than half of workers travel for work each day. Among workers aged 15 years and above, 57.6 percent perform within travel day trips to fixed or non fixed workplaces. The share is 54.5 percent in rural areas and 64.1 percent in urban areas. A fixed workplace is a regular office, factory, shop or site. A non fixed workplace includes street vending, construction coolie work or door to door services.
Two wheelers dominate this movement. They include scooters, motorcycles and mopeds. Among workers who travel to work, 42.6 percent use a two wheeler as the primary mode. The share is 37.1 percent in rural areas and 52.3 percent in urban areas. Low purchase cost, easy parking and ability to navigate narrow lanes explain this lead. Cars remain a small share at only 3.0 percent nationally.
| Primary Mode for Work Trips | Rural | Urban | All India |
|---|---|---|---|
| Two wheeler | 37.1 percent | 52.3 percent | 42.6 percent |
| Walking | 36.6 percent | 13.5 percent | 28.3 percent |
| Bicycle | 13.4 percent | 5.8 percent | 10.7 percent |
| Bus | 5.3 percent | 9.2 percent | 6.7 percent |
| Auto rickshaw | 5.0 percent | 8.8 percent | 6.4 percent |
| Car | 1.5 percent | 5.7 percent | 3.0 percent |
| Metro, monorail, suburban rail and tram | 0.4 percent | 5.0 percent | 2.1 percent |
The gender gap is sharp. Among male workers, 61.9 percent undertake daily work trips of more than 1 km. Among female workers, the share is only 41.9 percent. The gap reflects lower female labour force participation, care duties at home and safety and transport barriers. In urban areas, 52.9 percent of female workers travel for work, much higher than 37.7 percent in rural areas, which points to stronger formal job access in cities.
Public Transport Share in Daily Commute
Public transport carries a modest share of daily work trips. Buses account for 6.7 percent of worker commutes nationally. Metro systems, monorails, suburban rail and trams together account for 2.1 percent. Auto rickshaws, which offer shared and hired last mile links, carry 6.4 percent. Combined, these shared modes serve only about 15 percent of workers. The rest walk, cycle or use private two wheelers and cars.
Cities with rail based networks perform better. Among urban workers, metro, monorail, suburban rail and tram use is 5.0 percent nationally but jumps to 20.7 percent in Maharashtra, 16.5 percent in West Bengal and 14.4 percent in Delhi. Mumbai’s suburban rail, Kolkata’s suburban and metro links, and Delhi’s large metro network explain these hotspots. Maharashtra and Delhi also show higher bus use for work trips.
This contrast matters. High private vehicle dependence raises congestion, fuel use and road crash risk. Strong bus and rail networks, with frequent service and easy transfers, can shift commuters away from private vehicles. The survey gives planners ward level evidence on where gaps in frequency, route coverage and early morning and late night service remain.
How Much Does Commuting Cost Every Month?
Travel costs pinch urban families more. A worker commuting to a fixed workplace spends an average of ₹785 per month. Urban workers spend ₹1,044 per month, while rural workers spend ₹612 per month. Fuel, fares and maintenance drive this difference. Longer distances in sprawling cities add to the bill.
Students spend less but the rural urban gap persists. A student spends an average of ₹443 per month on trips to and from the educational institution. Urban students spend ₹617 per month, compared with ₹361 per month in rural India. Many rural students walk or cycle, which keeps cash costs low.
Gender differences also appear in spending. Male workers spend an average of ₹835 per month on fixed workplace commutes, compared with ₹533 per month for female workers. Shorter trips, higher walking shares and part time or nearby work partly explain lower spending among women workers.
How Long Is the Commute and When Do People Travel?
Most daily trips are short. The average travel time from origin is 23 minutes for students (23 minutes in rural areas and 22 minutes in urban areas) and 25 minutes for workers going to a fixed workplace (23 minutes in rural areas and 27 minutes in urban areas). Nearly 87.6 percent of students reach their institution within 30 minutes. Similarly, 83.4 percent of workers reach their fixed workplace within 30 minutes, while 13.7 percent take 30 to 60 minutes.
State patterns vary. Rajasthan, Gujarat and Madhya Pradesh record average work travel times of around 20 to 23 minutes. Parts of southern India show higher times. Nagaland records 37 minutes, Delhi 35 minutes, West Bengal 32 minutes, and Himachal Pradesh and Maharashtra 30 minutes each. Hilly terrain, long city sprawls and congested corridors increase time. Northeastern states including Assam show shorter school travel times of 15 to 19 minutes.
Morning roads carry the peak load. About 82.0 percent of students leave home between 7 AM and 10 AM, with the single busiest hour of 8 AM to 9 AM taking 35.7 percent of departures. Among workers to fixed workplaces, 94.9 percent leave before 10 AM. The 8 AM to 10 AM window takes 56.5 percent, followed by 6 AM to 8 AM with 33.7 percent. Only 4.7 percent leave before 6 AM. These peaks guide decisions on bus frequency, metro headway and school start time staggering.
Overnight Journeys and Non Work Travel
Overnight trips tell a different story from daily commutes. Buses dominate long stays away from home. Among household overnight trips, buses account for 55.8 percent and intercity railways account for 17.7 percent. Together, they carry 73.5 percent of such trips. Cars follow with 15.1 percent and two wheelers with 8.8 percent.
Rail use rises in cities. About 14.0 percent of rural overnight trips use railways, compared with 22.7 percent among urban households. Better station access, higher incomes and online booking support this urban lead.
Purpose matters more than distance. Social visits, communication and religious activities drive 70.2 percent of overnight trips (69.7 percent in rural areas and 70.9 percent in urban areas). Culture, leisure, sports and tourism account for only 7.4 percent (9.3 percent in urban areas). Self care and health related maintenance accounts for 6.5 percent. The data shows that family events and pilgrimages, not holidays, power most overnight movement.
Other daily trips for shopping, domestic work and caregiving rely on flexible modes. For within day trips other than education and employment, people mainly use two wheelers (32.2 percent), walking (24.9 percent), auto rickshaws (18.9 percent), bicycles (12.6 percent) and buses (8.5 percent). Unpaid domestic services for household members alone account for 54.1 percent of persons reporting such trips.
What Is MoSPI and What Is NSO in India?
MoSPI stands for the Ministry of Statistics and Programme Implementation. It is the nodal ministry of the Government of India for official statistics and for monitoring plan and programme implementation. It releases key data on national income, prices, employment and industry, and it maintains an advance release calendar for transparency.
NSO stands for the National Statistics Office. It functions as the statistical wing of MoSPI and serves as the executive arm for data collection and publication. The present NSO took shape when the Central Statistics Office (CSO) and the National Sample Survey Office (NSSO) were merged into a single National Statistics Office in May 2019. The CSO compiled macro data such as gross domestic product, industrial production and inflation. The NSSO ran large sample surveys on health, education, employment and household spending. Their merger ended parallel silos and placed field work, processing and national accounts under one umbrella headed by the Secretary of the ministry.
The NSO runs a continuous survey system. The Periodic Labour Force Survey (PLFS), launched in 2017, measures employment, worker population ratio and unemployment every month and every year. The Household Consumption Expenditure Survey tracks family spending. The Annual Survey of Industries and the Annual Survey of Unincorporated Sector Enterprises track factories and small firms. The National Household Travel Survey joins this family as the first dedicated travel survey. Like other NSO surveys, it protects respondent identity and publishes only aggregate results and reports.
Why the Findings Matter for Transport Planning
India builds roads, metros and rail links with limited hard data on actual travel demand. City plans often rely on small traffic counts or old project reports. The National Household Travel Survey fills this gap with a national benchmark. It shows how people really travel, not how planners assume they travel.
Four uses stand out. First, route design. Bus agencies can match services to the 7 AM to 10 AM school and work peaks and strengthen feeder links to metro and suburban stations in Maharashtra, West Bengal and Delhi. Second, access and equity. High walking shares among students and women workers underline the need for safe footpaths, cycle tracks, street lights and affordable fares. Third, investment choice. Low metro and bus shares in daily work trips show that last mile links and service frequency matter as much as new lines. Fourth, railway planning. The finding that buses carry 55.8 percent of overnight trips against 17.7 percent for rail helps the Ministry of Railways assess unmet demand, coach allocation and timetable slots.
Regular repetition will increase value. A one time survey gives a snapshot. Repeated rounds will show whether metro expansions, e buses and safer walking zones shift people from two wheelers to shared modes. That trend line is the true test of transport policy.
Key Takeaways
- The National Household Travel Survey (July 2025 to June 2026) is India’s first ever nationwide household travel survey, released by the National Statistics Office on 5 October 2026.
- The survey covered 4,92,023 households and 20,34,371 persons across 14,274 villages and 10,377 urban blocks, counting only trips of 1 km or more.
- 66.4 percent of students aged 6 years and above travel daily for study, with walking (37.0 percent), bus (29.5 percent) and bicycle (15.8 percent) as the top three modes.
- 42.6 percent of workers use two wheelers for work commutes, while metro, monorail, suburban rail and tram together carry only 5.0 percent of urban worker trips nationally.
- Workers spend an average of ₹785 per month on fixed workplace commutes (₹1,044 urban and ₹612 rural), while students spend ₹443 per month.
- Buses (55.8 percent) and intercity railways (17.7 percent) together carry 73.5 percent of household overnight trips, driven mainly by social and religious purposes at 70.2 percent.