

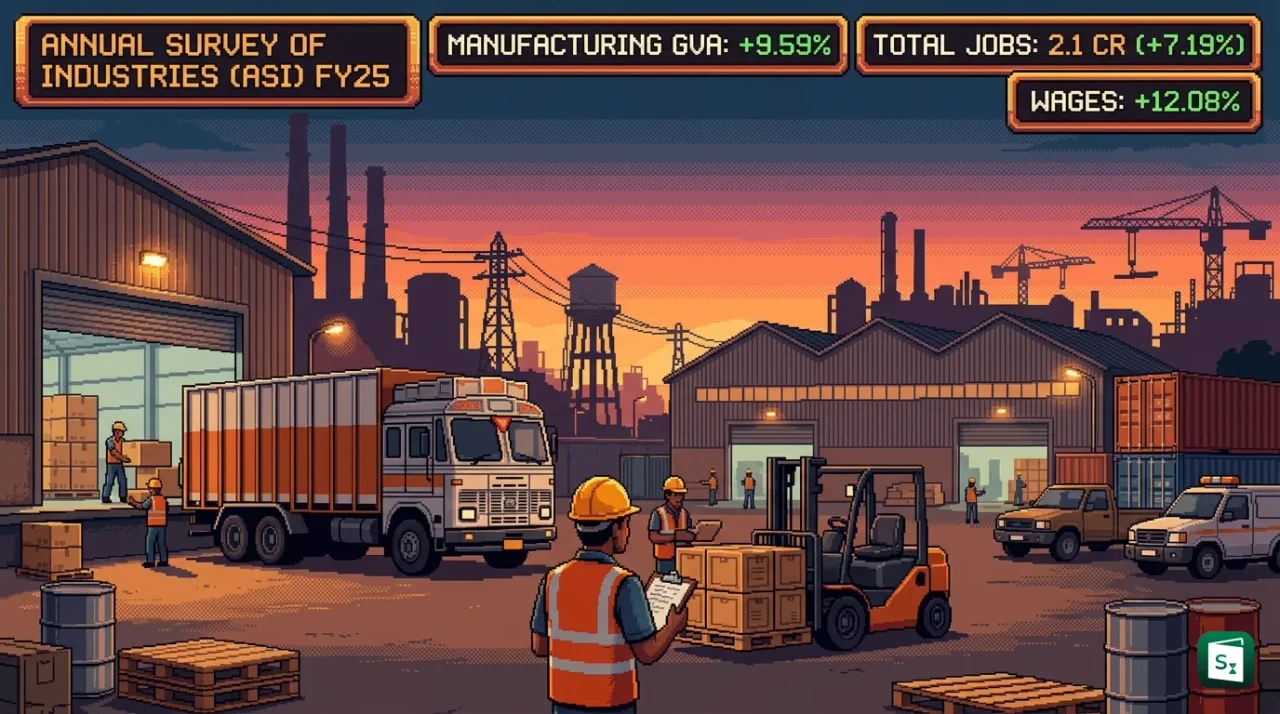
The Ministry of Statistics and Programme Implementation has released the results of the Annual Survey of Industries 2024-25. The survey reports that manufacturing Gross Value Added grew by 9.59 percent in FY25, while total employment rose by 7.19 percent to 2.1 crore. Tamil Nadu leads the country with 41,221 industrial establishments, and the top five states together hold 53.3 percent of all units.
What Is the Annual Survey of Industries?
The Annual Survey of Industries is India’s main source of data on the organised manufacturing sector. It covers factories registered under the Factories Act, 1948, along with electricity undertakings and selected repair and manufacturing units. The Ministry of Statistics and Programme Implementation (MOSPI) releases the survey through the National Statistics Office (NSO) headquartered in New Delhi.
The survey started in 1960 and provides yearly details on output, input, employment, wages, capital and value added. It covers units that employ 10 or more workers with power, and 20 or more workers without power. MOSPI collects the data through a detailed schedule and return filed by factories on its ASI portal. Policymakers use the results to track industrial growth, frame manufacturing policy and estimate national income.
Manufacturing GVA Growth in FY25
Gross Value Added, or GVA, measures the value a factory adds during production. It is the total value of output minus the cost of intermediate inputs such as raw materials, fuel and services consumed in the process. In simple terms, if a garment unit sells shirts worth ₹100 and spends ₹60 on cloth, buttons, power and transport, its GVA is ₹40.
The ASI 2024-25 reports that manufacturing GVA grew by 9.59 percent in FY25 over FY24. This rise points to stronger factory output and better value addition across industries. It also supports overall economic growth, since manufacturing is a large part of total GVA at the national level.
Gross Value Added Versus GDP
GVA and GDP (Gross Domestic Product) are closely linked but not identical. GDP equals the sum of GVA from all sectors plus taxes on products minus subsidies on products. GVA shows production from the supply side, while GDP shows the final market value after adjusting for taxes and subsidies. For this reason, economists study manufacturing GVA to judge factory performance, and GDP to judge the full economy.
Jobs and Earnings in Organised Manufacturing
The ASI 2024-25 reports total employment of 2.1 crore persons in organised manufacturing, with growth of 7.19 percent over FY24. This figure includes workers directly engaged in production as well as supervisory, managerial and other staff employed in factories. The rise suggests that factories added fresh jobs as output expanded.
Total emoluments paid to the workforce grew by 12.08 percent in FY25 compared to FY24. Emoluments include wages and salaries, bonuses, provident fund contributions and other staff welfare payments. The fact that pay growth was faster than job growth points to higher average earnings per worker and improved labour income in the sector.
| Indicator | FY25 Outcome |
|---|---|
| Manufacturing GVA growth | 9.59 percent |
| Employment growth | 7.19 percent |
| Total employment | 2.1 crore persons |
| Total emoluments growth | 12.08 percent |
State Rankings and Industrial Concentration
Tamil Nadu ranks first in number of industrial establishments with 41,221 units. The state has a wide base of textiles, automobile parts, leather, engineering goods and electronics units spread across Chennai, Coimbatore, Tiruppur and Hosur. A large count of registered factories gives it the top position in the ASI unit tally.
The report states that the top five states together account for 53.3 percent of total industrial establishments in India. This level of concentration means more than half of all organised factories are located in just five states. Such clustering reflects access to ports, power, skilled labour, industrial estates and transport links, and it also raises policy questions about balanced regional growth and support for industry in other states.
How ASI Fits With Other Industrial Data
The Annual Survey of Industries differs from the Index of Industrial Production (IIP). IIP is a monthly index that tracks short term changes in physical production in mining, manufacturing and electricity, with 2011-12 as the base year. ASI is an annual census style survey that gives detailed financial and employment data with a lag. IIP gives speed, while ASI gives depth.
The ASI 2024-25 follows the ASI 2023-24 edition, which also recorded gains in output, GVA and jobs after the post pandemic recovery. Readers compare the two editions to check whether manufacturing growth is steady or uneven. The full ASI report, data tables and microdata are released by MOSPI in PDF and online database form for researchers, policymakers and the public.
Key Takeaways
- The Annual Survey of Industries 2024-25 was released by the Ministry of Statistics and Programme Implementation.
- Manufacturing Gross Value Added grew by 9.59 percent in FY25.
- Total employment in organised manufacturing reached 2.1 crore persons with 7.19 percent growth.
- Total emoluments grew by 12.08 percent in FY25 over FY24.
- Tamil Nadu leads with 41,221 industrial establishments, and the top five states hold 53.3 percent of all units.