
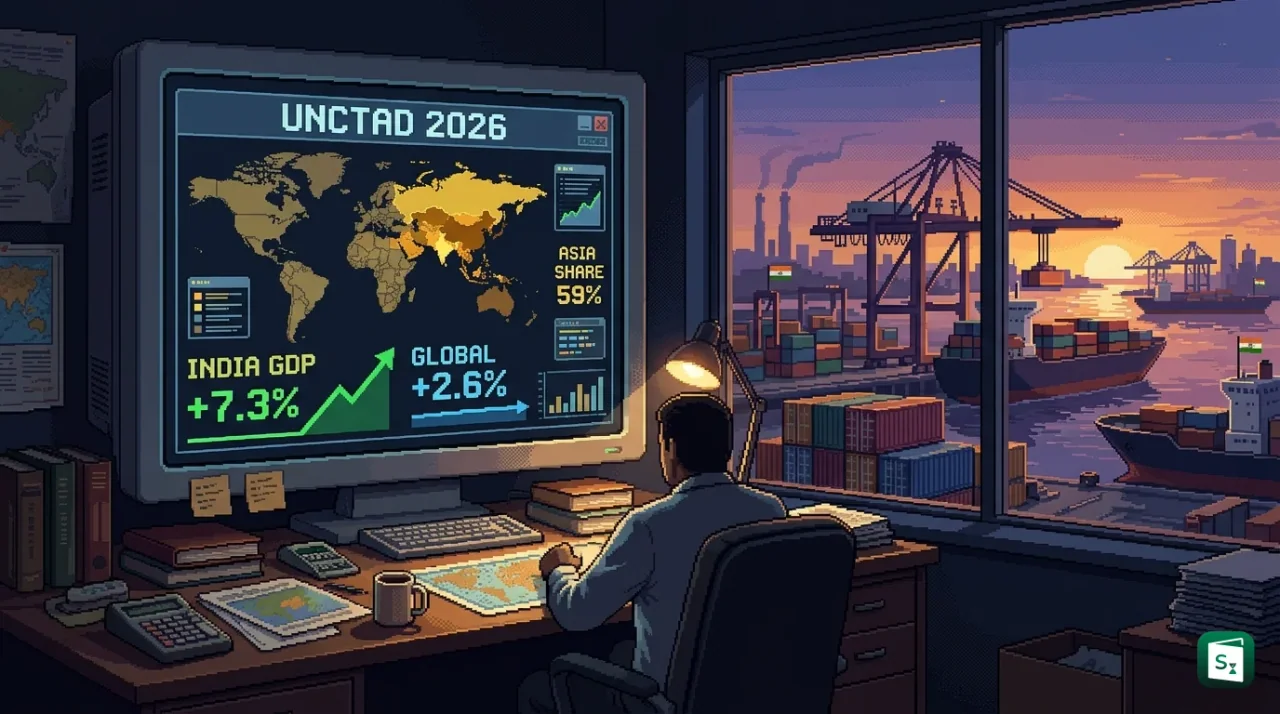
India’s economy is projected to grow 7.3% in 2026, making it the fastest-growing major economy in a world whose overall output will expand by just 2.6%, according to the Trade and Development Report 2026 released by the United Nations Conference on Trade and Development (UNCTAD) on 9 October 2026. The report, subtitled The Geoeconomics of Development, also projects growth in developing economies to slow to 4% and puts Asia’s share of global growth at 59%. India’s performance stands out because it is being achieved while trade rules, investment flows and technology access are increasingly shaped by strategic rivalry rather than cost alone.
What the UNCTAD Report Says About India’s GDP in 2026
The Trade and Development Report 2026 projects India’s real GDP to expand by 7.3% in 2026, the fastest rate among major economies, before easing to 6.8% in 2027. UNCTAD links this to strong domestic demand, growing manufacturing capacity and sustained public infrastructure spending. India, China and Indonesia together anchor Asia’s role as the main engine of global growth.
The report was released in Geneva on 9 October 2026 and uses information available up to 15 September 2026. It is a calendar-year projection, so the 7.3% figure refers to January to December 2026 and not to India’s fiscal year, which runs from April to March.
UNCTAD expects household consumption in India to grow 6.9% in 2026, slowing to 5.6% in 2027 as higher prices and input costs weigh on spending. The report also identifies India as one of a small group of developing countries with relatively strong readiness for frontier technologies, and as a destination for investment in strategic sectors.
| Economy or group | 2026 growth projection |
|---|---|
| World output | 2.6% |
| Developing economies | 4.0% |
| India | 7.3% |
| China | 4.5% |
| Indonesia | 5.2% |
| Viet Nam | 7.8% |
| Uzbekistan | 7.9% |
| Kyrgyzstan | 8.8% |
The table shows how narrow the base of global growth has become. Apart from a handful of Asian economies, most of the developing world is growing well below the pace needed to close the income gap with advanced economies. India is an outlier within that group, not the norm.
What Is UNCTAD and Why Does Its Flagship Report Matter?
UNCTAD is the United Nations Conference on Trade and Development, a permanent intergovernmental body established in 1964 to help developing countries integrate into the global economy on fairer terms. It is headquartered in Geneva, Switzerland, and has 195 member states. Its Trade and Development Report has been published every year since 1981.
The organisation was created by UN General Assembly Resolution 1995 (XIX) in December 1964, after its first conference was held in Geneva from March to June that year. The Group of 77, the largest coalition of developing countries at the United Nations, was founded at that first conference. UNCTAD’s first Secretary-General was the Argentine economist Raúl Prebisch, whose ideas on unequal exchange between rich and poor countries shaped the body’s early agenda.
| Feature | Detail |
|---|---|
| Full name | United Nations Conference on Trade and Development |
| Established | 1964, by UN General Assembly Resolution 1995 (XIX) |
| Headquarters | Geneva, Switzerland |
| Membership | 195 member states |
| Head | Pedro Manuel Moreno, Acting Secretary-General (as of October 2026) |
| Parent body | United Nations General Assembly |
| Flagship report | Trade and Development Report, published since 1981 |
UNCTAD works through three broad functions. It provides a forum where governments negotiate and build consensus on trade and development issues. It carries out research and policy analysis, which feeds into reports such as this one. It also offers technical assistance to developing countries, especially the least developed countries and small island states.
Apart from the Trade and Development Report, UNCTAD publishes the World Investment Report, the Least Developed Countries Report, the Digital Economy Report and the Review of Maritime Transport. These reports are widely used by governments, multilateral institutions and researchers, which is why the annual growth projections carry weight beyond academic circles.
The 2026 edition was prepared by a team led by Anastasia Nesvetailova of UNCTAD’s Division on Globalization and Development Strategies. Its central argument is that economic policy has become an instrument of strategic competition, a shift that affects not just how fast countries grow but whether the traditional export-led path to development remains open.
Why Is India Growing at 7.3% When the Global Economy Is Slowing?
India’s 7.3% projection rests mainly on domestic demand rather than exports. Household consumption, public capital expenditure, manufacturing output and services are all expanding, which cushions India from weaker demand in the United States, Europe and China. UNCTAD also credits rising manufacturing capacity and years of sustained infrastructure investment for the relatively high growth path.
Official data for the first quarter of 2026-27 supports this reading. India’s real GDP grew 7.8% between April and June 2026, the highest first-quarter growth in four years, while real gross value added rose 8.2%. Manufacturing grew 9.2% and services 10%, with financial, real estate, information technology and professional services expanding at 12.1%.
| Expenditure component | Q1 2025-26 | Q1 2026-27 |
|---|---|---|
| Gross fixed capital formation | 5.8% | 11.9% |
| Private final consumption expenditure | 6.8% | 7.1% |
| Exports of goods and services | 6.0% | 12.0% |
The sharp jump in fixed investment matters because it adds to future capacity. Capital goods production rose 15.2% in the June quarter, and the Union Budget for 2026-27 raised the Centre’s capital expenditure by 11.5%, while keeping the fiscal deficit target at 4.3% of GDP. That combination of public investment and fiscal restraint gives private firms room to plan long-term projects without fearing a sudden spike in borrowing costs.
Manufacturing, Infrastructure and Digital Public Infrastructure
India’s manufacturing push is visible in sectors that sit close to global supply chains. Electrical equipment output rose 27% in the June quarter, other transport equipment 19.5%, and computer and electronic products 12.4%. These are precisely the industries that governments elsewhere are trying to attract through subsidies and investment screening, so India’s ability to expand them matters beyond its own borders.
The report also notes India’s use of digital public infrastructure as a form of regional cooperation. UNCTAD records agreements to share India’s DPI model with 23 countries, with technical cooperation under way in eight. It links this to the Bay of Bengal Initiative for Multi-Sectoral Technical and Economic Cooperation (BIMSTEC), a grouping of seven South Asian and Southeast Asian countries that includes India, Bangladesh, Bhutan, Nepal, Sri Lanka, Myanmar and Thailand.
This matters for two reasons. First, digital payments and identity systems lower the cost of doing business and widen access to credit. Second, they give India a channel of influence that does not depend on tariff preferences or goods trade, which is useful when trade rules are being politicised.
What Is GDP and How Does India Measure It?
Gross domestic product (GDP) is the total market value of all final goods and services produced within a country’s borders during a given period, usually a year or a quarter. India’s GDP is compiled by the National Statistical Office (NSO) under the Ministry of Statistics and Programme Implementation, using production, expenditure and income approaches.
The word “final” matters. If a mill buys wheat and sells flour, only the value added at the mill is counted, not the full value of the flour. Otherwise the same wheat would be counted twice. GDP also covers production inside India’s geographical territory, regardless of who owns the factory.
| Measure | What it shows |
|---|---|
| Nominal GDP | Output valued at current market prices, so it includes inflation |
| Real GDP | Output valued at constant prices, so it captures actual volume growth |
| GDP deflator | The ratio of nominal to real GDP, used as a broad inflation measure |
| Gross value added (GVA) | Output minus intermediate consumption, measured by sector |
| GDP per capita | GDP divided by population, a rough measure of average output per person |
The expenditure method adds up private consumption, government spending, investment and net exports. The production method sums value added across agriculture, industry and services. The income method adds wages, profits, rent and interest. In practice, statistical agencies combine these approaches because no single method captures every transaction in a large informal economy.
Two cautions follow. First, nominal GDP can rise simply because prices are rising, so growth comparisons use real GDP. Second, GDP per capita says nothing about how income is distributed. India’s nominal GDP is roughly $4.1 trillion in 2026, but its per-capita income remains far below advanced-economy levels, which is why a 7.3% growth rate is necessary but not sufficient for broad prosperity.
The Geoeconomics Behind the Numbers: How Trade Rules Are Changing
Geoeconomics refers to the use of economic instruments such as tariffs, subsidies, export controls and investment screening to pursue strategic and security goals. In 2026, governments are using these tools to secure semiconductors, artificial intelligence infrastructure, cloud computing, clean energy technologies and critical minerals. Market access increasingly depends on strategic alignment, not just price and quality.
UNCTAD groups the instruments into three broad families. Market access tools include tariffs, tariff quotas and trade remedies aimed at specific partners. Industrial and financial tools include subsidies, local-content requirements, procurement preferences and investment incentives. Security and technology tools include export controls, investment screening, procurement exclusions, cybersecurity requirements and end-use monitoring.
The result is selective fragmentation. Global trade has not collapsed. It reached a record $35 trillion in 2025 and grew 4.4% in real terms, with growth of about 4% projected for 2026. But trade is reorganising along strategic lines. Trade between China and the United States has fallen by more than 20% since 2024, while East Asia has expanded trade with both China and North America.
Investment is following the same pattern. Developed economies captured around 70% of announced greenfield investment in strategic sectors between 2020 and 2025. In semiconductors, their share was almost four-fifths. Developing economies lead only in critical minerals, where they attracted 59% of new investment, yet they capture little of the downstream value. Africa mines most of the world’s cobalt, but less than 1% of the value in global green supply chains stays on the continent.
| Strategic sector | Developed economies | Developing economies |
|---|---|---|
| Semiconductors | 79% | 21% |
| Advanced and sensitive technologies | 77% | 23% |
| AI infrastructure and related technologies | 64% | 36% |
| Energy transition technologies | 61% | 39% |
| Critical minerals and strategic materials | 41% | 59% |
The artificial intelligence boom illustrates the concentration problem. AI-related products have become the main driver of merchandise trade, but 82% of value added in the category accrues to just four supplier segments. In a case study of an advanced AI server rack, post-tax profits accounted for 68% of value added, while workers received less than 15%. A country can export chips or assemble servers and still capture very little of the final value.
For India, this landscape creates both opportunity and risk. Supply-chain diversification can bring new orders and investment. But access to those markets increasingly requires compliance with standards, traceability rules and investment screening regimes, which raises the cost of entry for smaller firms.
Asia’s 59% Share and the Widening Development Divide
Asia is projected to contribute 59% of global growth in 2026, led by India, China and Indonesia. That share is not evidence of broad prosperity. UNCTAD finds that a small group of Asian economies is converging with advanced economies, while most of the developing world has been falling further behind since the mid-2010s.
The scale of the divergence is striking. In the early 1990s, a group of eight Asian economies had an average output per person less than half that of the remaining developing countries. By 2026, their average is projected to be roughly twice as high. The eight economies in the comparison are China, India, Indonesia, Malaysia, Singapore, Viet Nam, Hong Kong SAR and Taiwan Province of China.
Investment flows reinforce the gap. Developing Asia attracted $561 billion in greenfield investment in strategic sectors between 2020 and 2025, compared with $126 billion for Latin America and $71 billion for Africa. About three-quarters of the developing-economy total went to Asia, and semiconductors alone accounted for a fifth of developing Asia’s strategic investment.
| Pressure point | UNCTAD estimate for 2026 |
|---|---|
| Official development assistance | Fall of almost 7%, the third consecutive annual decline |
| Aid as a share of donor income | 0.23%, far below the 0.7% UN target |
| Financing gap for the Sustainable Development Goals | $4.3 trillion |
| Volatility in non-resident portfolio flows | Twice the 2014 to 2025 average |
| Brent crude price after the West Asia conflict | From about $70 to more than $110 per barrel |
The energy shock has made matters worse. Higher crude prices raise import bills, weaken currencies and force governments to choose between subsidising fuel and funding schools or hospitals. UNCTAD estimates that the currencies of energy importers excluding China depreciated by almost 4% in 2026.
Aid budgets are shrinking at the same time. Official development assistance is projected to fall by almost 7% in 2026, the third straight annual decline. For least developed countries and small island developing states, which rely on concessional finance, this compounds the effect of costlier private borrowing.
How India’s 7.3% Forecast Compares With Other Projections
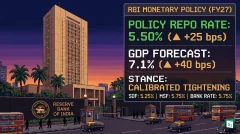
UNCTAD’s 7.3% projection for calendar year 2026 is close to the International Monetary Fund’s 7.4% estimate and slightly above the 7.1% fiscal-year forecasts of the Reserve Bank of India and the World Bank. Most of the gap comes from calendar-year versus fiscal-year definitions, along with different assumptions about oil prices and domestic demand.
| Institution | India projection | Reference period | Release |
|---|---|---|---|
| UNCTAD | 7.3% | Calendar year 2026 | October 2026 |
| UNCTAD | 6.8% | Calendar year 2027 | October 2026 |
| IMF | 7.4% | Calendar year 2026 | October 2026 |
| IMF | 7.0% | Fiscal year 2026-27 | October 2026 |
| RBI | 7.1% | Fiscal year 2026-27 | October 2026 |
| World Bank | 7.1% | Fiscal year 2026-27 | October 2026 |
The reference period matters. India’s fiscal year 2026-27 runs from April 2026 to March 2027, so it overlaps two calendar years. A calendar-year projection and a fiscal-year projection can therefore differ even when the underlying assessment of the economy is similar. Analysts often compare them without adjusting for this, which produces misleading claims about which agency is more optimistic.
Global forecasts diverge more sharply. The IMF projects world growth of 3.1% in 2026, while the World Bank’s June 2026 estimate was 2.5%, with a worst-case scenario of 1.3%. UNCTAD’s 2.6% sits near the World Bank figure. Differences in country weights, exchange-rate assumptions, treatment of purchasing power parity and the timing of data cut-offs explain much of the variation.
For India, the direction of revisions has been upward through 2026. The IMF raised its fiscal-year forecast from 6.4% in July to 7.0% in October, citing resilient domestic demand and strong services activity. The World Bank and the RBI made similar upgrades after the first-quarter GDP print came in at 7.8%.
What Are the Main Risks to India’s Growth Outlook?
The biggest risks are high oil import dependence, rising food and fuel inflation, tariff uncertainty in the United States trade negotiations, volatile portfolio flows and the narrow base of the artificial intelligence boom. India’s large domestic market provides a buffer, but it cannot fully insulate the economy from geopolitical shocks.
Oil, Inflation and the Energy Shock
India imports more than 85% of its crude oil, so a sustained rise in Brent prices feeds directly into transport, power and manufacturing costs. UNCTAD notes that India’s reliance on imported oil remains a source of vulnerability to the energy shock that followed the West Asia conflict. A wider current account deficit and a weaker rupee are the usual consequences.
Inflation is already visible. Retail inflation rose to 5.54% in September 2026, the highest reading of the year, with food inflation at 7.74%. Onion prices more than doubled during the year. Food prices matter disproportionately in India because food has a large weight in the consumption basket, and poor households spend a bigger share of their income on it.
UNCTAD expects household consumption growth to slow from 6.9% in 2026 to 5.6% in 2027 as higher prices and input costs bite. A below-normal southwest monsoon, projected by the India Meteorological Department, adds a rural demand risk on top of the price pressure.
Tariffs, Trade Deals and Financial Volatility
India is finalising the first phase of a trade agreement with the United States and is seeking preferential market access and greater tariff stability. Failure to conclude the deal could hurt export-facing sectors, although new agreements, including the India-UK Comprehensive Economic and Trade Agreement that entered into force on 15 July 2026, offer some diversification.
Financial channels carry their own risk. UNCTAD reports that volatility in non-resident portfolio flows doubled in 2026 compared with the 2014 to 2025 average. Capital is also concentrated in a small number of technology firms, so a correction in global AI valuations could spill into emerging-market currencies and equity markets.
Domestic constraints limit the policy response. Fiscal space is narrower than it was before the pandemic, and the government has chosen to keep the deficit at 4.3% of GDP in 2026-27 rather than spend more freely. That is prudent, but it means India cannot fully offset a global slowdown through public spending alone.
What Does UNCTAD Recommend for Developing Countries?
UNCTAD recommends long-term support for domestic industry, financial policies that tie foreign investment to local suppliers and technology transfer, a deliberate shift into higher-value activities, and stronger regional cooperation on trade, payments and technology. It also asks developing countries to diversify export markets and accelerate the energy transition.
| Policy priority | What it involves |
|---|---|
| Support industry over the long term | Build skills, research capacity and local suppliers until firms can compete without protection |
| Use financial policy for industrial goals | Link foreign investment to local sourcing, technology transfer and more value created at home |
| Move up the value chain | Shift from assembly and raw-material extraction into design, components and services |
| Strengthen regional cooperation | Work together on trade, payment systems, technology and industrial development |
The emphasis on regional cooperation is notable. UNCTAD points to local-currency settlement arrangements, shared digital infrastructure and regional trade groupings as ways for developing countries to reduce dependence on a single market or currency. India’s push to share its digital public infrastructure and its role in BIMSTEC fit this template.
India’s domestic policy already reflects parts of this advice. Production Linked Incentive schemes, the National Manufacturing Mission, PM GatiShakti and the Unified Payments Interface all aim to build capacity, lower logistics costs and widen access to digital finance. The test is whether these programmes raise domestic value addition, not just output.
The report is advisory. UNCTAD has no power to enforce its recommendations, and many developing countries lack the fiscal space to subsidise strategic industries for years. That gap between advice and capacity is the central tension in the report.
For India, the medium-term challenge is to convert a high growth rate into durable income gains. The RBI has estimated that reaching high-income status by 2047-48 would require real GDP growth of about 7.6% a year over the next two decades. UNCTAD’s 7.3% projection is therefore close to the required trajectory, but it is a single-year estimate, not a guarantee of sustained convergence.
Key Takeaways
- UNCTAD’s Trade and Development Report 2026, subtitled The Geoeconomics of Development, was released on 9 October 2026 and projects India’s GDP growth at 7.3% in 2026.
- Global growth is projected to slow to 2.6% in 2026 from 2.9% in 2025, while developing economies are projected to grow 4%, down from 4.7%.
- Asia is expected to contribute 59% of global growth in 2026, with China growing at 4.5% and Indonesia at 5.2%.
- India’s real GDP grew 7.8% in the first quarter of 2026-27, and UNCTAD expects growth to ease to 6.8% in 2027.
- UNCTAD was established in 1964, is headquartered in Geneva, has 195 member states, and has published the Trade and Development Report since 1981.
- Global trade reached a record $35 trillion in 2025 and is projected to grow about 4% in 2026, even as trade between China and the United States fell by more than 20% since 2024.
- Developed economies captured about 70% of greenfield investment in strategic sectors between 2020 and 2025, while developing economies led only in critical minerals, with 59% of new investment.
- Official development assistance is projected to fall by almost 7% in 2026, its third consecutive annual decline.