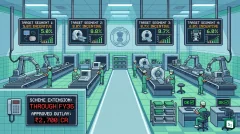


NITI Aayog released the report titled Impact Assessment of PLI Schemes in November 2026, prepared with the Indian Institute of Management Ahmedabad as knowledge partner. The report assesses all 14 Production Linked Incentive (PLI) schemes up to March 2026, when 58% of their combined implementation period was complete. It finds investment at ₹2.4 lakh crore and production at ₹22.66 lakh crore, with nearly 70% of targeted segments on track.
What Is the Production Linked Incentive Scheme?
The Production Linked Incentive (PLI) scheme is a performance linked industrial policy that pays cash incentives to companies for extra sales of goods made in India. The incentive is calculated on incremental sales over a fixed base year. A company must first invest an agreed amount and meet production thresholds, and only then receives payment.
The scheme was first launched in March 2020 for mobile manufacturing and specified electronic components, drugs intermediaries and medical devices. It was expanded in November 2020 and in the Union Budget 2021-22 to cover 14 sectors, as a central part of Atmanirbhar Bharat and Make in India. The aim is to build scale, cut imports, raise exports, create jobs and make Indian firms part of global value chains.
The total approved financial outlay is ₹1.91 lakh crore for the 14 schemes. Each scheme is run by its own line ministry or department, while overall coordination rests with the Department for Promotion of Industry and Internal Trade. NITI Aayog, the policy think tank of the Government of India set up on 1 January 2015 and headquartered in New Delhi, vetted the sectors and now monitors progress.
What the NITI Aayog Impact Assessment Found
NITI Aayog published the Impact Assessment of PLI Schemes in November 2026 with the Indian Institute of Management Ahmedabad (IIM Ahmedabad) as knowledge partner. IIM Ahmedabad, set up in 1961 and located in Ahmedabad in Gujarat, analysed data supplied by central ministries and departments. The report is a mid course review, not a final verdict.
The report judges the 14 schemes on four outcomes: investment, production and sales, employment and exports. Together, the schemes had completed 578 months out of a total of 996 months, which is 58% of their combined implementation time. About 42% of the total time was still left in March 2026.
Instead of expecting results to move in line with time, the report uses a 50% threshold as a mid course screen. A scheme that has already reached half of its full period target is treated as broadly on track, while a scheme below half needs closer examination. On this test, nearly 70% of targeted segments are on track. The report also states that final success will still be judged against 100% of the full period targets.
How Investment, Production and Jobs Compare With Targets
The headline finding is a split result. Investment and output are well past the halfway mark, while job creation is still low. The report says this pattern is normal for factory projects, where money is spent first, output rises after plants open, and hiring picks up last.
| Outcome up to March 2026 | Actual | Full period target | Share of target |
|---|---|---|---|
| Investment | ₹2.4 lakh crore | ₹3.15 lakh crore | 76% |
| Production and sales | ₹22.66 lakh crore | ₹35.37 lakh crore | 64% |
| Employment | 8.49 lakh jobs | 30.19 lakh jobs | 28% |
| Incentive paid | ₹35,354 crore | ₹1.91 lakh crore outlay | 18.51% |
Production has stayed close to or above yearly goals. Achievement was 102% up to 2022-23, 96% in 2023-24, 107% in 2024-25 and 119% in 2025-26. Jobs show a mixed path. Yearly achievement was 86% up to 2022-23, about 85% in 2023-24 and 156% in 2024-25, before falling to 31% of the yearly target in 2025-26.
Payments remain low by design. Incentives are not paid in advance. Firms receive money only after they prove investment and production. Annual payouts have improved, from 63% of the planned amount up to 2023-24 to 71% in 2024-25 and 100% in 2025-26. Total payout over those years stands at 78% of the planned amount for the period.
Which Sectors Are Performing Well and Which Are Lagging?
The 14 schemes do not share the same goal. Some aim to cut imports, others aim to build export scale. Capital heavy and technology heavy sectors also need more time. The report therefore reads each sector with its gestation period in mind.
Large scale electronics, pharma drugs, food processing, drones, medical devices and white goods show progress on several measures. Automobiles and auto components, telecom and speciality steel show strong investment and output but need more work on jobs, exports and local value addition. Advanced Chemistry Cell batteries and some advanced components are still in the building stage.
| Sector group | Outlay | Progress up to March 2026 |
|---|---|---|
| Large Scale Electronics Manufacturing | ₹34,193 crore | Strong performer in mobiles, with high output, sales, exports and jobs, and base for the new component scheme |
| IT Hardware | Part of electronics pool | Investment of about ₹954 crore and output of ₹24,386 crore reported by mid 2026 |
| Pharma Drugs | ₹15,000 crore | About 1.14 lakh jobs among top job creators |
| Bulk Drugs | ₹6,940 crore | Investment ₹5,211 crore, sales ₹3,792 crore, 5,127 jobs |
| Medical Devices | ₹3,420 crore | Investment ₹1,185 crore, sales ₹16,612 crore, 5,769 jobs |
| Food Processing | ₹10,900 crore | Investment above ₹9,207 crore, strong gains in ready foods and fruit and vegetable products |
| White Goods for air conditioners and LED lights | ₹6,238 crore | Investment ₹6,409 crore, output ₹43,150 crore, 52,703 jobs, local value addition up from 20% to 55% |
| Drones and Drone Components | ₹120 crore | 77.5% of funds paid, steady rise in turnover and investment |
| Telecom and Networking | ₹12,195 crore | 33,610 jobs, early import substitution gains |
| Automobiles and Auto Components | ₹25,938 crore | Investment ₹44,326 crore, sales ₹52,414 crore, 67,820 jobs |
| Speciality Steel | ₹6,322 crore | Investment ₹23,896 crore, sales of 2,774 thousand tonnes, 14,138 jobs, only one firm paid so far |
| High Efficiency Solar PV Modules | ₹24,000 crore | National capacity up from 8 GW to nearly 116 GW, about 20.7% linked to PLI projects |
| Advanced Chemistry Cell Battery | ₹18,100 crore | Only 1.4 GWh built against 50 GWh plus 5 GWh target, no commercial output yet |
| Textiles for manmade fibre and technical textiles | ₹10,683 crore | Investment ₹8,117 crore, sales ₹11,241 crore, 33,427 jobs since 2022-23 start |
Food products created about 3.29 lakh jobs, the highest among schemes, followed by large scale electronics with 1.69 lakh jobs. Auto, white goods, telecom and textiles each created between 33,000 and 68,000 jobs. Solar, steel, bulk drugs, medical devices, IT hardware, drones and batteries each added fewer than 15,000 direct jobs in the review data.
Why Job Creation Lags Behind Investment and Output
The report links the jobs gap to how factories grow. Investment comes first for land, machines and buildings. Output rises when plants are commissioned and use improves. Hiring grows more slowly and reaches full strength only when operations turn fully commercial. So the three headline numbers need not move at the same speed.
Capital intensity also matters. Sectors with high automation can invest large sums without adding many workers. Technology intensive sectors need longer testing and approval periods. The report notes that strict output and employment conditions can reduce take up in sectors with long gestation or uncertain demand linked to trade and geopolitics. It suggests closer work with industry while fixing sector targets and adding demand support.
Data gaps add to the problem. Export and employment records are incomplete for several schemes, which makes full assessment hard. The report warns that higher sales value does not always mean higher physical output, since prices can rise. It also warns that investment does not by itself prove extra production beyond the normal industry trend. A mix of value, volume, capacity use, productivity, jobs, exports and local value addition gives a fairer picture.
How Incentives Are Paid and What the Report Recommends
Incentives under PLI are paid only after performance. A firm must show the agreed investment and incremental sales before it can claim money. Nine schemes, including bulk drugs, automobiles and textiles, had paid less than 10% of their own outlays by March 2026. Drones, large scale electronics and food products had paid between 25% and 77%.
The report calls for steady monitoring for the remaining 42% of the implementation period. It seeks faster removal of sector bottlenecks, better Centre and state coordination on ground level clearances, stronger export market work, and better reporting on jobs and exports. It also seeks deeper local value addition, stronger supply chains for parts and materials, and wider participation of small firms so that large beneficiaries pull smaller suppliers with them.
Key Takeaways
- The Impact Assessment of PLI Schemes by NITI Aayog with IIM Ahmedabad reviews all 14 sectors up to March 2026 after 58% of total implementation time.
- PLI schemes reached ₹2.4 lakh crore in investment, which is 76% of the full period target of ₹3.15 lakh crore.
- PLI schemes recorded ₹22.66 lakh crore in production and sales, which is 64% of the full period target of ₹35.37 lakh crore.
- Employment reached 8.49 lakh jobs, which is 28% of the full period target of 30.19 lakh jobs.
- Cumulative incentive payment stood at ₹35,354 crore, which is 18.51% of the total outlay of ₹1.91 lakh crore, since incentives are paid only after performance conditions are met.