

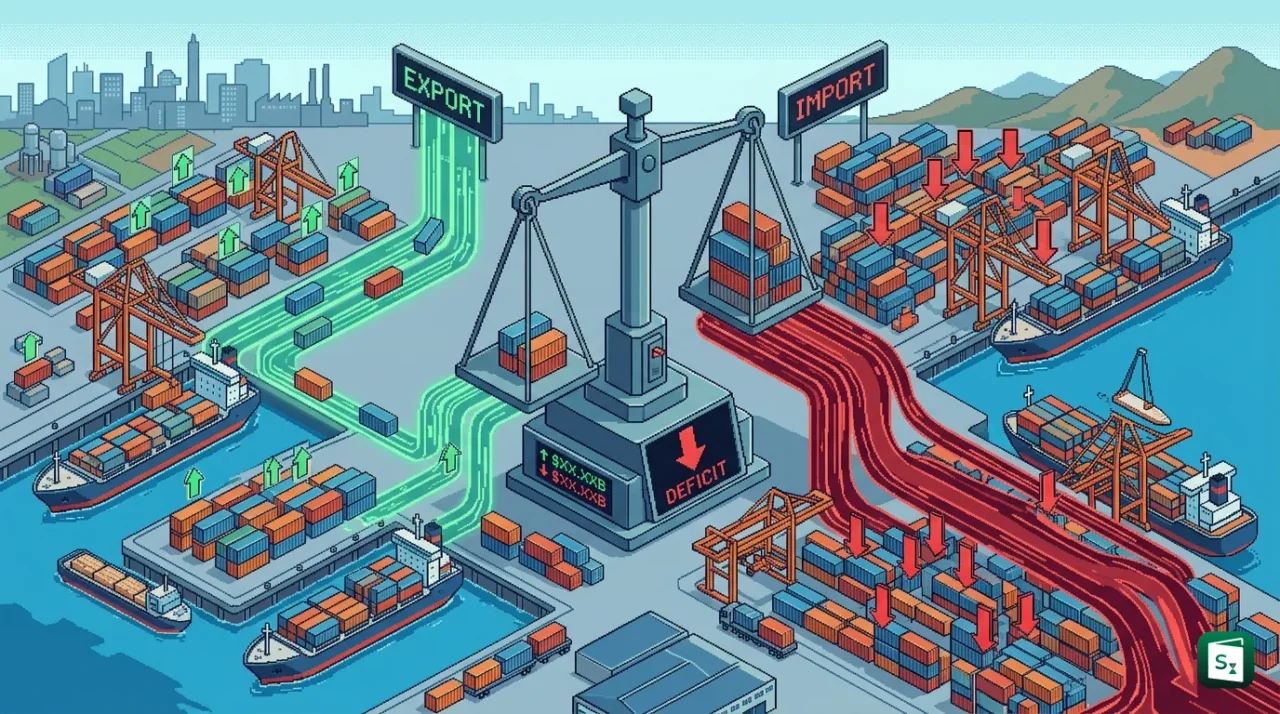
India’s total exports including both goods and services rose to $80.14 billion in July 2026, a 13.31% increase over the same month last year, while total imports grew faster at 15.83% to $95.16 billion. The faster rise in imports pushed India’s overall trade deficit to $15.03 billion, up from $11.43 billion in July 2025. The data, released by the Ministry of Commerce and Industry, shows strong export momentum that was outpaced by domestic demand and higher import costs.
What the Latest Trade Numbers Show
The latest estimates were released by the Department of Commerce under the Ministry of Commerce and Industry on 13 August 2026. The Ministry is the nodal ministry for India’s foreign trade and is headquartered in New Delhi. Trade statistics are compiled by the Directorate General of Commercial Intelligence and Statistics (DGCI&S), headquartered in Kolkata and established in 1862, while services trade estimates are based on data from the Reserve Bank of India (RBI), established in 1935 and headquartered in Mumbai.
For July 2026, services figures are still an estimate because the latest actual RBI data available at the time of release was for June 2026. Data for the previous year has been revised on a pro rata basis using quarterly balance of payments information.
| Category | July 2026 ($ Billion) | July 2025 ($ Billion) | Year-on-Year Change |
|---|---|---|---|
| Merchandise Exports | 44.24 | 36.98 | 19.63% |
| Merchandise Imports | 76.22 | 64.86 | 17.51% |
| Services Exports* | 35.89 | 33.74 | 6.38% |
| Services Imports* | 18.94 | 17.30 | 9.48% |
| Total Exports (Merchandise + Services) | 80.14 | 70.72 | 13.31% |
| Total Imports (Merchandise + Services) | 95.16 | 82.16 | 15.83% |
| Total Trade Balance (Deficit) | -15.03 | -11.43 | 31.49% wider |
The cumulative picture for the first four months of the financial year 2026-27 (April to July) shows the same trend. Exports have grown strongly, but imports have grown even faster.
| Category | April-July 2026-27 ($ Billion) | April-July 2025-26 ($ Billion) | Growth |
|---|---|---|---|
| Merchandise Exports | 173.78 | 148.48 | 17.04% |
| Merchandise Imports | 292.38 | 245.14 | 19.27% |
| Services Exports* | 142.64 | 131.15 | 8.76% |
| Services Imports* | 73.47 | 66.81 | 9.97% |
| Total Exports | 316.42 | 279.63 | 13.16% |
| Total Imports | 365.85 | 311.94 | 17.28% |
| Overall Deficit | -49.43 | -32.32 | 52.94% wider |
In simple terms, a trade deficit occurs when a country’s imports are worth more than its exports in a given period. Here, it is calculated as total exports minus total imports for both merchandise (physical goods) and services combined. The July deficit of $15.03 billion and the four month deficit of $49.43 billion therefore mean India bought more from the world than it sold during these periods.
What Drove the Export Surge
Merchandise exports were the main driver of growth in July. They rose to $44.24 billion, up 19.63% from $36.98 billion in July 2025. This was the highest July merchandise export figure on record and came despite global uncertainty and disruptions in West Asia.
The strongest performers were:
| Commodity Group | July 2026 Exports ($ Billion) | July 2025 ($ Billion) | Growth |
|---|---|---|---|
| Petroleum Products | 6.92 | 4.13 | 67.64% |
| Electronic Goods | 5.92 | 3.76 | 57.40% |
| Engineering Goods | 12.24 | 10.40 | 17.71% |
| Organic and Inorganic Chemicals | 2.80 | 2.45 | 14.39% |
| Cotton Yarn, Fabrics and Handloom Products | 1.11 | 1.02 | 8.40% |
Other categories that recorded positive growth included meat, dairy and poultry products, cashew, marine products, drugs and pharmaceuticals, and handicrafts. This broad based growth suggests demand was not limited to one sector.
Two indicators show the underlying strength of exports even without volatile items. Non-petroleum exports rose to $37.32 billion in July and $143.61 billion during April to July, up 12.79% cumulatively. Non-petroleum and non-gems and jewellery exports, which remove both oil and gold related swings, were $35.00 billion in July and $134.02 billion cumulatively, higher than the same period last year. These measures help assess the real trend by removing price swings in oil and precious metals.
The cumulative merchandise exports for April to July reached $173.78 billion, compared with $148.48 billion a year earlier, a growth of 17.04%. Services exports also supported the overall rise, estimated at $35.89 billion in July and $142.64 billion cumulatively, growing steadily year on year.
Why Imports Rose Faster and the Deficit Widened
Despite record exports, imports grew even faster. Merchandise imports in July jumped to $76.22 billion from $64.86 billion last year, a rise of 17.51%. Services imports rose to $18.94 billion from $17.30 billion. Together, total imports reached $95.16 billion, widening the gap.
This is why the trade deficit grew by about 31.5% year on year in July. The four month deficit also widened sharply to $49.43 billion, compared with $32.32 billion in April to July 2025.
Several factors explain the import pressure. First, strong domestic demand and industrial activity pushes up imports of capital goods, intermediate goods and machinery when factories expand and infrastructure projects continue. Electronics, electrical machinery and non-electrical machinery imports have shown double digit growth in recent months. Second, petroleum and energy needs remain high as India imports more than 80% of its crude oil requirements. Even when petroleum product exports rise, crude import costs can stay elevated due to global oil prices and shipping costs, partly linked to tensions around the Strait of Hormuz, a key global energy chokepoint connecting the Persian Gulf to the Arabian Sea. Third, gold and precious metals continue to be large import items for jewellery and investment demand. Silver imports fell in July, but gold and related gems and jewellery imports have kept the non-oil, non-gems category elevated.
Excluding petroleum and gems and jewellery, imports were still higher at $51.82 billion in July compared with $43.07 billion a year earlier, and $192.03 billion cumulatively compared with $160.95 billion previously. This indicates that import growth was broad based, not limited to oil or gold alone.
On the supply side, the top sources where imports grew sharply in July included Russia, China, Oman, Taiwan and the United States, reflecting diversified sourcing for energy, electronics components, and industrial inputs. Top export destinations that grew strongly were the United States, China, Singapore, Kenya and Malaysia, showing some diversification beyond traditional markets.
The Services Trade Cushion
India consistently runs a surplus in services trade, which partly offsets the large deficit in merchandise trade. In July 2026, services exports of $35.89 billion exceeded services imports of $18.94 billion, leaving a services surplus of about $16.95 billion. For April to July, the services surplus was about $69.17 billion, up from $64.35 billion a year earlier.
This surplus comes mainly from IT and business services, financial services, telecommunications, and professional services, where India has a strong global presence. However, in July and in the April to July period, services imports also grew at a faster pace than services exports, so the cushion did not fully prevent the overall trade deficit from widening.
It is important to distinguish the trade deficit from the current account deficit (CAD). The trade deficit covers only goods and services. The CAD is broader. It includes the trade balance plus net income from abroad, such as profits and salaries, and net transfers such as remittances from Indians working overseas. Because India receives large remittances and earns net income from services, its CAD is typically much smaller than its merchandise trade deficit. In FY 2024-25, for example, India’s CAD narrowed to about $23.3 billion, or 0.6% of GDP, even though the overall trade deficit was significantly larger.
Understanding this difference helps explain why a widening monthly trade deficit does not automatically mean a severe external imbalance, though sustained import growth faster than export growth does require close monitoring.
Why This Data Matters
The July numbers are significant for several reasons.
First, the record merchandise exports signal resilience. Despite global slowdown concerns and West Asia disruptions, Indian engineering goods, electronics, and chemicals found strong buyers. Electronics exports, supported by the Production Linked Incentive (PLI) scheme launched in 2020 to boost domestic manufacturing across 14 sectors, rose sharply. This suggests that incentives for mobile phones, semiconductors, and components are beginning to translate into outbound shipments.
Second, the data highlights India’s position in global trade. In calendar year 2024, India ranked 18th globally in merchandise exports with about $443 billion and 9th in imports with about $702 billion, according to global trade outlook data. In services, India ranked 8th with a 4.3% share of global commercial services exports, worth about $374 billion. Total exports, including merchandise and services, reached $860.09 billion in FY 2025-26, up 4.22% over the previous year, while total imports were $979.40 billion. Examining non-petroleum and non-gems and jewellery trends helps policymakers see whether export growth is driven by value added manufacturing or by volatile commodity prices.
Third, the deficits and surpluses affect India’s external financing. Trade is part of the Balance of Payments, which is managed under the Foreign Trade Policy 2023 and monitored by the RBI. A higher trade deficit can put pressure on the rupee and on foreign exchange reserves if not balanced by capital inflows such as Foreign Direct Investment (FDI), portfolio investment, or remittances. So far, services earnings and remittances have provided a buffer, but persistent gaps could widen the CAD if global commodity prices stay elevated.
Finally, the data is released monthly and is closely watched as a bellwether for domestic demand, industrial activity, and global competitiveness. The July figure was a six month high for the merchandise deficit at $31.98 billion (merchandise imports of $76.22 billion minus merchandise exports of $44.24 billion), indicating that import demand remains firm even as exports hit new highs.
The Way Forward
Maintaining export momentum while containing the deficit will require focus on domestic value addition and market diversification. The government has set a long term goal of reaching $2 trillion in total exports by FY 2030-31, with $1 trillion each from merchandise and services. Recent Free Trade Agreements (FTAs) with partners such as the UAE, Australia and the European Free Trade Association (EFTA) are expected to improve market access, and the Commerce Ministry has announced workshops to help exporters use FTA provisions more effectively.
Improving the quality of growth will also matter. Reading non-petroleum exports as the core measure and tracking whether electronics export growth reflects genuine manufacturing or assembly of imported components will be important. Reducing dependence on imported crude through energy diversification, expanding domestic production of electronics and machinery, and managing gold imports will influence the future trade balance.
For now, the July 2026 data presents a mixed but familiar pattern for India. Strong goods and services exports demonstrate competitive strength, a rising services surplus provides stability, and yet higher imports driven by domestic growth and global price pressures keep the overall trade gap elevated.
Key Takeaways
- India’s total exports (merchandise and services) grew 13.31% year on year to $80.14 billion in July 2026, while total imports rose 15.83% to $95.16 billion.
- The overall trade deficit widened to $15.03 billion in July 2026 from $11.43 billion in July 2025, an increase of about 31.5%.
- Merchandise exports hit a record July high of $44.24 billion (up 19.63%), led by petroleum products up 67.64%, electronic goods up 57.40% and engineering goods up 17.71%.
- Cumulative April to July 2026-27 exports were $316.42 billion and imports $365.85 billion, leaving a deficit of $49.43 billion compared with $32.32 billion a year earlier.
- The services surplus of about $16.95 billion in July (exports $35.89 billion, imports $18.94 billion) partly offset the merchandise deficit, but was not enough to prevent widening of the overall gap.
- Data is released by the Ministry of Commerce and Industry with merchandise data from DGCI&S, Kolkata (1862) and services estimates from RBI, Mumbai (1935), with July services figures still an estimate based on June RBI data.