

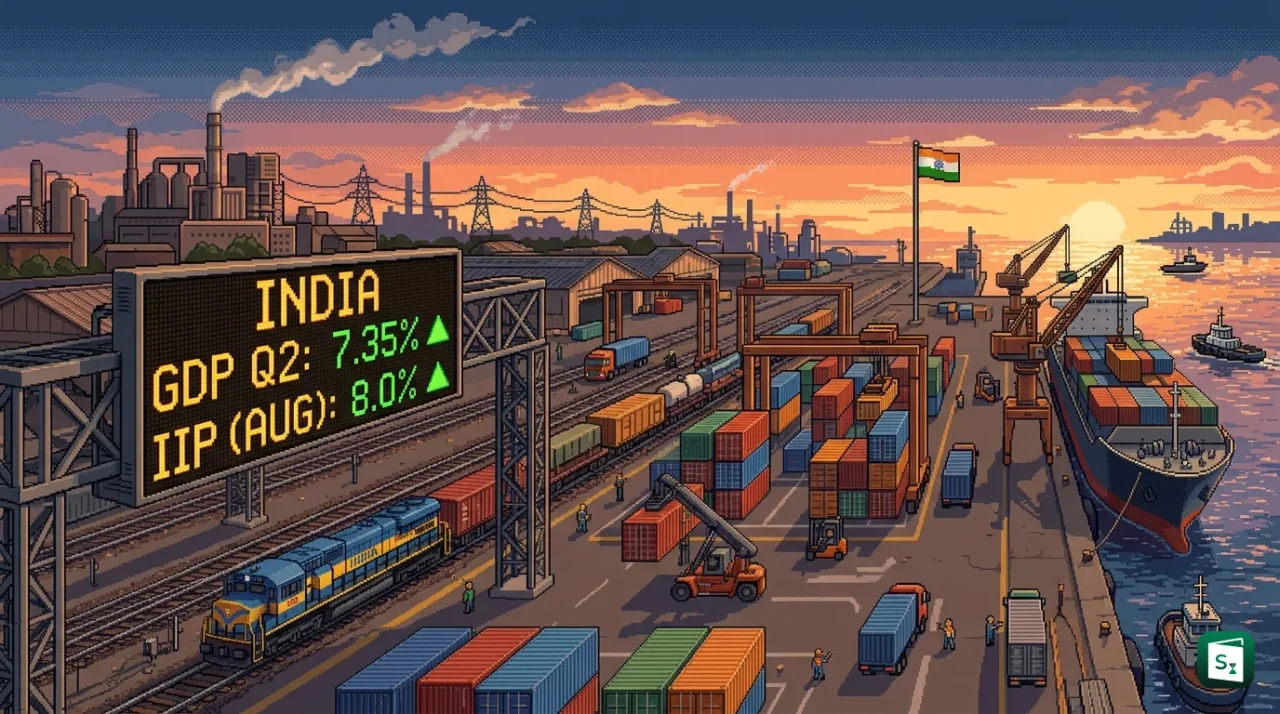
The Department of Economic Affairs under the Ministry of Finance has projected the GDP growth of India at 7.35 percent for Q2 of FY27 covering July to September 2026. The estimate appears in the Monthly Economic Review for October 2026 and builds on 7.8 percent growth in Q1. The Index of Industrial Production, which rose 8 percent in August 2026, emerged as the strongest signal of continued momentum.
What Is GDP and How Is GDP Growth Rate Calculated in India?
Gross Domestic Product (GDP) is the total market value of all final goods and services produced within India during a specific period. GDP in economics measures the size of the national economy of India in money terms. GDP growth rate shows how fast this value rises after removing the effect of price changes.
The National Statistical Office (NSO) under the Ministry of Statistics and Programme Implementation (MoSPI) compiles GDP estimates in India. MoSPI follows the globally accepted System of National Accounts 2008 and uses a benchmark indicator method for quarterly estimates. Annual data acts as the benchmark, and high frequency indicators are used to estimate quarterly output.
India calculates two main forms of GDP. Nominal GDP values output at current prices. Real GDP values output at base year prices, which removes inflation. India revised its GDP base year from 2011-12 to 2022-23 in February 2026 because 2022-23 was a normal year with complete survey data.
The GDP growth rate is calculated by comparing real GDP in one period with real GDP in the same period of the previous year. The formula is current period real GDP minus previous period real GDP, divided by previous period real GDP, multiplied by 100. So 7.35 percent Q2 growth means real output in July to September 2026 was 7.35 percent higher than in July to September 2025.
Two related terms often appear with GDP. Gross Value Added (GVA) is the value of output minus the cost of inputs like raw materials. GDP equals the sum of GVA of all sectors plus taxes on products minus subsidies on products. The GDP deflator is nominal GDP divided by real GDP multiplied by 100, and it measures overall price change.
What the Monthly Economic Review for October 2026 Projects for Q2 FY27
The Department of Economic Affairs (DEA) in the Ministry of Finance releases the Monthly Economic Review each month to assess recent trends. The October 2026 edition was released on 29 October 2026. It uses a nowcasting model to estimate GDP before official quarterly data is published.
Nowcasting uses very recent data to update the forecast for the immediate quarter. The DEA introduced this model in the Economic Survey 2025-26. For Q2 FY27, the model estimates real GDP growth at 7.35 percent. This is slightly higher than the 7.3 percent estimate made in the September review.
The review said high frequency indicators were stronger in Q2 than in Q1. These indicators include industrial output, energy consumption, port traffic, Goods and Services Tax (GST) collections, and automobile sales. Gross GST collections grew about 15 percent in the quarter, compared with about 8.4 percent in Q1. Domestic automobile sales rose about 25 percent year on year.
The official Q2 GDP data will be released by MoSPI on 30 November 2026. The DEA cautioned that considerable global uncertainty remains. Elevated crude oil prices, higher food inflation, and an uncertain outlook for the kharif crop will shape policy in the second half of FY27. The review said sustaining activity while protecting price stability will be the main focus through March 2027.
Why the Index of Industrial Production Rose 8 Percent in August 2026
The Index of Industrial Production (IIP) tracks the volume of industrial output in India over a short period. The index is compiled by the NSO and released on the 28th of every month. The current series uses 2022-23 as the base year.
In August 2026, IIP recorded 8 percent year on year growth. The overall index stood at 123.3 against 114.2 in August 2025. Growth accelerated from 6.7 percent in the July quick estimate, which was later revised to 7.4 percent. Manufacturing has now grown at 8 percent or more for three straight months.
Sector wise performance in August was uneven. Manufacturing, which carries the largest weight, grew 9 percent. Electricity and gas supply grew 12.3 percent. Water supply, sewerage and waste management grew 6.3 percent. Mining and quarrying contracted by 5.6 percent as fuel minerals and non metallic minerals declined.
| IIP Sector in August 2026 | Index Value | Year on Year Growth |
|---|---|---|
| Manufacturing | 126.6 | 9 percent |
| Electricity and gas supply | 133.9 | 12.3 percent |
| Water supply, sewerage and waste management | 147.6 | 6.3 percent |
| Mining and quarrying | 85.7 | minus 5.6 percent |
| Overall IIP | 123.3 | 8 percent |
Which Manufacturing Industries Led the Growth
Within manufacturing, 18 of 23 industry groups recorded positive growth in August. The top three contributors were electrical equipment at 30.9 percent, other transport equipment at 25.3 percent, and motor vehicles, trailers and semi trailers at 25.2 percent. Auto components, passenger cars, and commercial vehicles drove motor vehicle growth. Switchgear, circuit breakers, control panels, optical fibre connectors, and UPS systems drove electrical equipment growth. Two wheelers and railway rolling stock supported other transport equipment.
Other strong segments included rubber and plastics products at 21.4 percent, computer, electronic and optical products at 19.3 percent, beverages at 18.3 percent, and textiles at 13.1 percent. Four groups declined. Tobacco products fell 8 percent, wearing apparel fell 7.4 percent, pharmaceuticals fell 1.6 percent, and chemicals fell 0.5 percent.
How Capital Goods and Intermediate Goods Drove Demand
IIP is also grouped by use to show what the output is used for. Capital goods are machinery used to make other goods. Intermediate goods are inputs like steel or plastic parts. In August, capital goods grew 16.9 percent and intermediate goods grew 13.7 percent. Consumer durables grew 11.1 percent. Infrastructure and construction goods grew 6.4 percent. Primary goods grew 3.5 percent and consumer non durables grew 2.1 percent. Intermediate goods, capital goods, and consumer durables were the top three contributors to overall growth. For April to August FY27, overall IIP grew 6.7 percent, with manufacturing up 7.4 percent.
How Q2 Fits Into the Full FY27 Growth Picture
Q1 FY27 growth was 7.8 percent, well above most forecasts. Real GDP in Q1 was estimated at Rs 81.36 lakh crore, compared with Rs 75.46 lakh crore a year earlier. Nominal GDP grew 10.3 percent to Rs 88.27 lakh crore. Manufacturing grew 9.2 percent in Q1, and financial, real estate and professional services grew 12 percent. Gross fixed capital formation rose 11.9 percent, showing strong investment.
The October review raised the full year FY27 forecast to 7.3 percent, up from 6.8 to 7.2 percent projected in the Economic Survey 2025-26. The Reserve Bank of India (RBI), established in 1935 and headquartered in Mumbai, raised its FY27 forecast to 7.1 percent in October. The RBI expects Q2 at 7.2 percent, Q3 at 6.9 percent, and Q4 at 6.8 percent. It also raised the repo rate by 25 basis points to 5.5 percent to manage inflation.
Global agencies have turned more positive. The International Monetary Fund (IMF), headquartered in Washington D C and founded in 1944, raised its FY27 forecast to 7 percent. The World Bank, also headquartered in Washington D C and founded in 1944, raised its forecast to 7.1 percent. The Organisation for Economic Cooperation and Development also projects 7.1 percent. The review said healthy credit growth and recent trade agreements should support consumption, investment, and exports in the rest of the year.
| Institution | FY27 GDP Forecast for India | Date of Revision |
|---|---|---|
| Ministry of Finance | 7.3 percent | October 2026 |
| RBI | 7.1 percent | October 2026 |
| IMF | 7 percent | October 2026 |
| World Bank | 7.1 percent | October 2026 |
What Is the GDP of India Today in Trillion Terms and Global Rank
In nominal terms, India is now a multi trillion dollar economy. Estimates place current GDP in India at more than $4 trillion, which makes India one of the five largest economies in the world. On a calendar year basis, the IMF expects India to grow 7.4 percent in 2026 and 7 percent in 2027.
In terms of rank, India is the fifth largest economy by nominal GDP and the third largest by purchasing power parity. Purchasing power parity adjusts for price differences across countries. India ranks far lower on GDP per capita, which is total GDP divided by population. GDP per capita in India is about $2,800 to $3,000, with a global rank outside the top 130. This gap shows that total size is large, but income per person remains modest.
India per person income and GDP of Indian states vary widely. Maharashtra, Tamil Nadu, Gujarat, and Karnataka contribute the largest shares to national GDP. The central government measures state output as Gross State Domestic Product (GSDP). GSDP plus central taxes helps explain regional differences in growth and living standards.
Why GDP Is Important for the National Economy of India
GDP growth shows whether jobs, incomes, and production are expanding. When GDP grows near 7 percent, firms invest more, banks lend more, and tax collections rise. This gives the government more room to spend on roads, railways, health, and support for farmers.
GDP also guides monetary policy. The RBI watches real GDP growth and inflation together to set interest rates. Strong growth with high inflation can lead to a rate rise, as seen in October 2026. Weak growth with low inflation can lead to a rate cut. Investors use GDP data to judge demand for steel, cement, vehicles, and housing.
GDP is not a complete measure of welfare. It does not capture unpaid work, inequality, or environmental damage. A rise in oil prices, for example, can raise nominal GDP through higher prices while reducing real incomes. That is why the October review warned that global price shocks can distort the link between nominal and real growth, and why policymakers track employment, inflation, and per capita income alongside GDP.
Key Takeaways
- The Monthly Economic Review for October 2026 projects 7.35 percent real GDP growth for Q2 FY27 covering July to September 2026.
- The Index of Industrial Production grew 8 percent in August 2026, led by 9 percent growth in manufacturing and 12.3 percent growth in electricity and gas supply.
- India recorded 7.8 percent GDP growth in Q1 FY27, and MoSPI will release official Q2 data on 30 November 2026.
- The Finance Ministry raised its full year FY27 forecast to 7.3 percent, while the RBI projects 7.1 percent and the IMF projects 7 percent.
- India compiles GDP on a 2022-23 base year through the NSO under MoSPI, and GDP equals total GVA plus taxes minus subsidies.